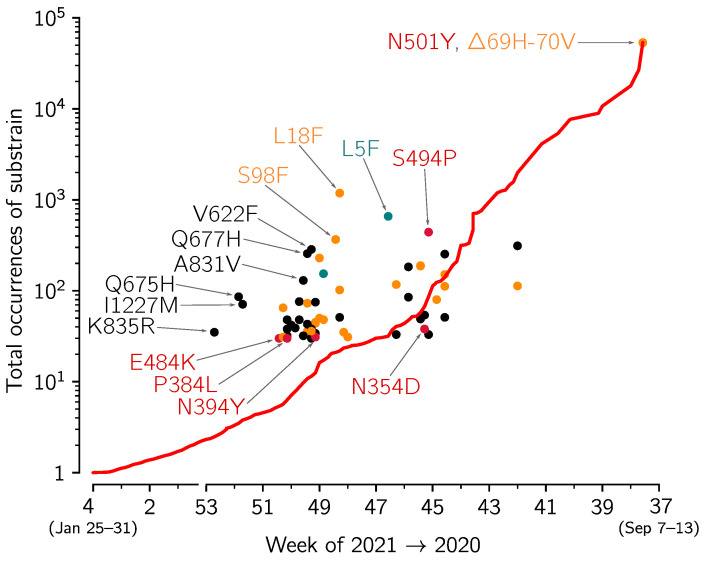
Figure 6.
The growth of VOC substrains with respect the whole VOC strain. The figure is based on spike protein sequences from genomes collected in England and submitted to GISAID till 12 February 2021. The growth of the whole VOC strain (red line) in the time span between t and = 12 February 2021 is calculated as VOC()/VOC(t), i.e., the ratio of the number of the VOC genomes collected till 12 February 2021 and the number of VOC genomes collected till t (date given on horizontal axis). Disks denote VOC substrains defined by particular mutations (with at least 30 genomes submitted); horizontal axis value for each circle is the date of first collection of a sequence with a given mutation; vertical axis value is the number of genomes collected till 12 February 2021, conferring a given mutation. Red, orange, and green circles denote substrains with leading mutation in respectively in RBD, NTD, and signal peptide; black circles denote mutations in other domains. Selected substrains that may have replicative advantage and all substrains with the leading mutation in RBD are annotated. Detailed data that were analyzed to prepare this figure are provided in Supplementary Data File S1 (sheet ‘Mutations’).

