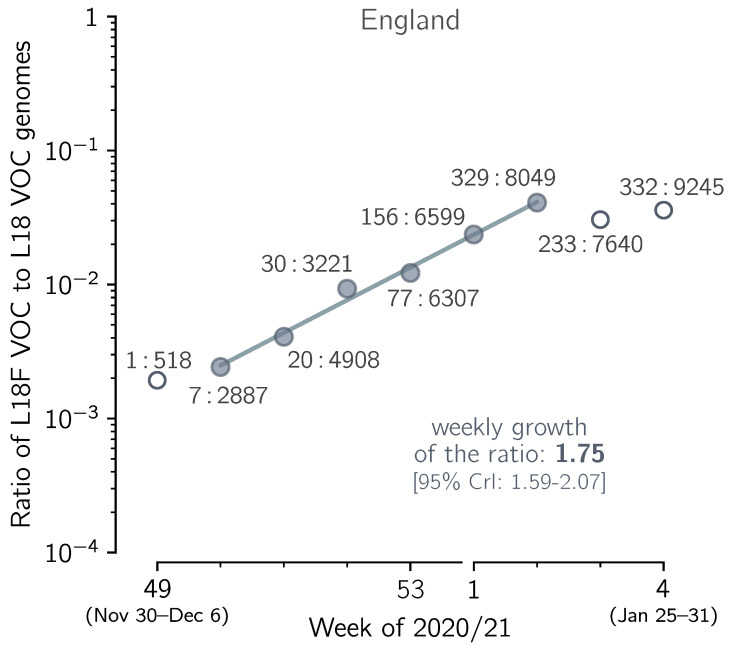
Figure 7.
The growth of the spike L18F substrain in relation to the L18 VOC strains. The ratio of the number of VOC genomes conferring spike L18F mutation to the number of non-mutated (L18) VOC genomes collected in the period between week 49 of 2020 and week 3 of 2021 in England. Data aggregated into weeks indicated that changes from 7:2887 = 0.0024 in week 50 of 2020 to 329:8049 = 0.041 in the second week of 2021, i.e., 16.9 times, meaning that increases = 1.76-fold per week. The trend line is fitted to data points shown as filled circles. The weekly growth rate of the ratio is 1.75. The 95% CI calculated as 1.96 × standard error of the slope is [1.66–1.85]; the 95% CrI calculated assuming binomial distribution of substrain genomes is [1.59–2.07]. Data points in week 50 of 2020 and week 2 of 2021 are labeled with ratios of the counts of both types of genome sequences. The figure is based on GISAID data submitted until 12 February 2021 (provided in Supplementary Data File S1).

