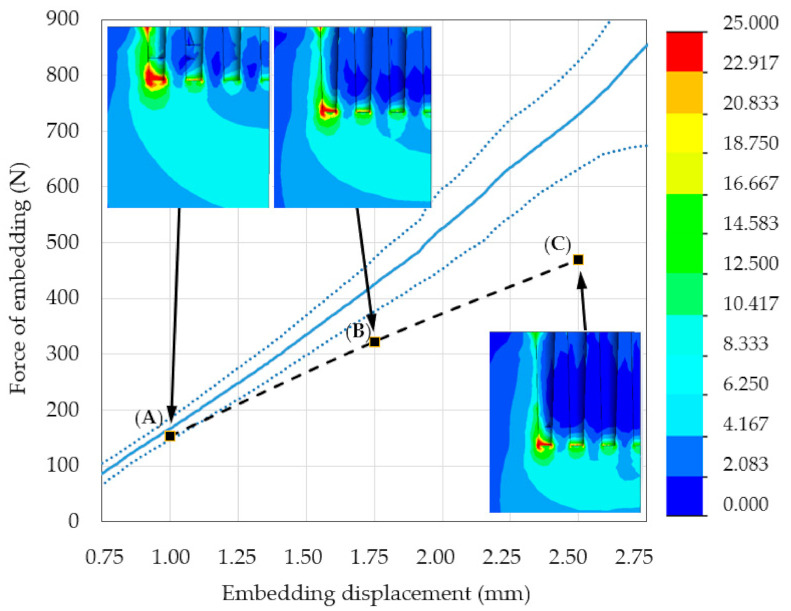
Figure 9.
Region II of the force–distance curves obtained from experimental measurements (the mean line is presented as the solid blue line, dotted blue lines are ± standard deviations) and from numerical simulations. The dashed black line represents results of numerical simulation of the problem. The insets show representative maps of the Huber–von Mises–Hencky (HMH) stress distributions calculated for the considered system containing the MSC-Scaffold prototype and periarticular bone material with the embedding load applied to the top surface of the MSC-Scaffold prototype. (A) 1 mm embedding displacement and 153 N force of embedding; (B) 1.75 mm embedding displacement and 322 N force of embedding; (C) 2.5 mm embedding displacement and 469 N force of embedding.

