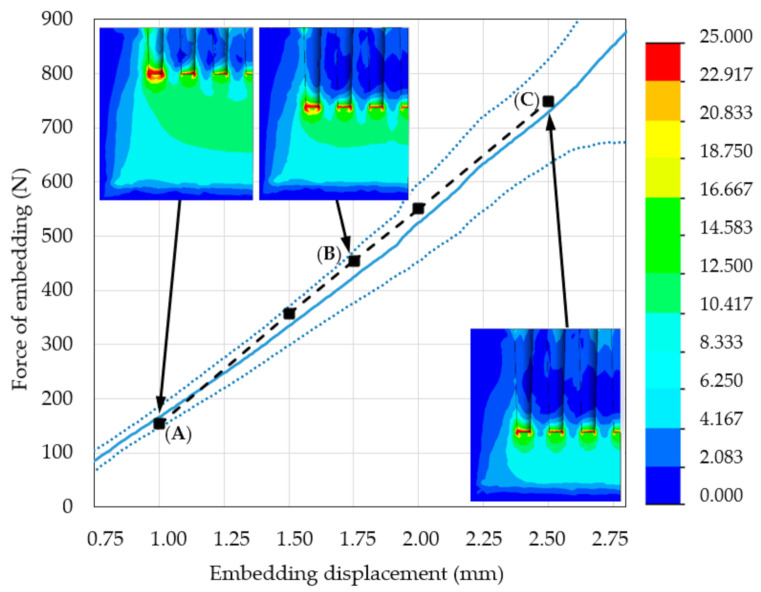
Figure 12.
Region II of the force–distance curves obtained from experimental measurements (the mean line is presented as the solid blue line, dotted blue lines are ± standard deviations) and the results of re-simulations with FE model modified by the simulated insert of densified bone material (dashed black line) at (A) 1.00 mm embedding displacement and 153 N loading force; (B) 1.75 mm embedding displacement and 453 N loading force; (C) 2.50 mm embedding displacement and 748 N loading force.

