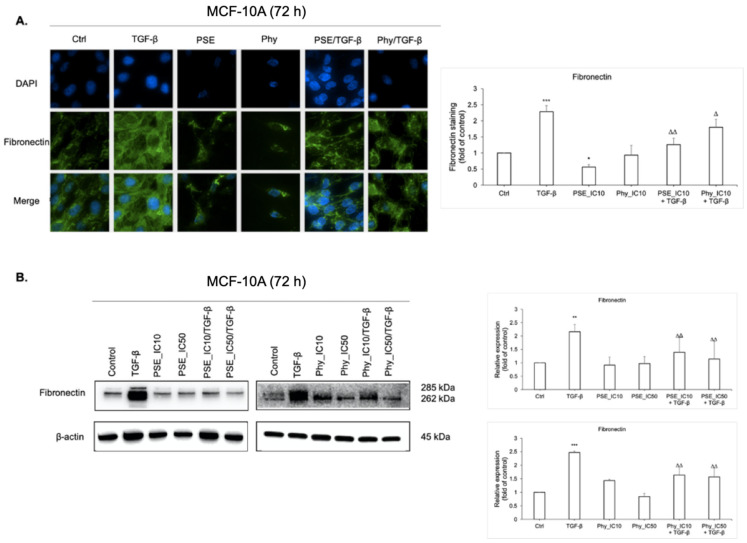
Figure 8.
PSE and Phy reduced expression of fibronectin. (A) Immunofluorescence detection of fibronectin in MCF-10A cells. The green signal represents corresponding protein staining by Alexa Fluor 488 and the blue signal indicates nuclei staining by DAPI. Original magnification x200. The fluorescence staining of fibronectin was analysed using ImageJ software. Quantification is relative to the control. The protein levels of mesenchymal marker fibronectin were assayed by Western blot analysis (B) using IC10 and IC50 concentrations of PSE and Phy. The band intensities of target protein were measured using the Image Studio Lite software. Quantification is relative to the control and normalised to β-actin expression. Data in graphs are shown as mean ± SD for three separate experiments. * p < 0.05, ** p < 0.01, *** p < 0.001 compared to control; Δ p < 0.05, ΔΔ p < 0.01 compared to TGF-β.

