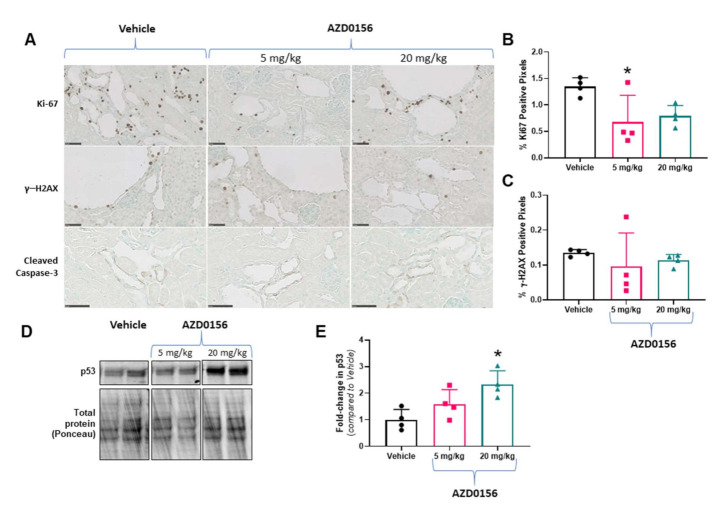
Figure 4.
Effect of AZD0156 on renal cell proliferation, DNA damage and p53 in Pkd1RC/RC mice. (A) Representative histological images of renal cortex showing Ki-67+ cells (DAB-positive cells) (upper panel), gH2AX (middle panel), and cleaved caspase-3 (lower panel) in the experimental groups. Scale bars, 50 µM. (B) Mean Ki-67-positive pixel quantification in the experimental groups. (C) Mean γ-H2AX-positive pixel quantification in the experimental groups. (D,E) Representative western blots and quantitative analysis for renal p53 expression; * p < 0.05 compared to vehicle; Data presented as means ± SD (n = 4 per group).

