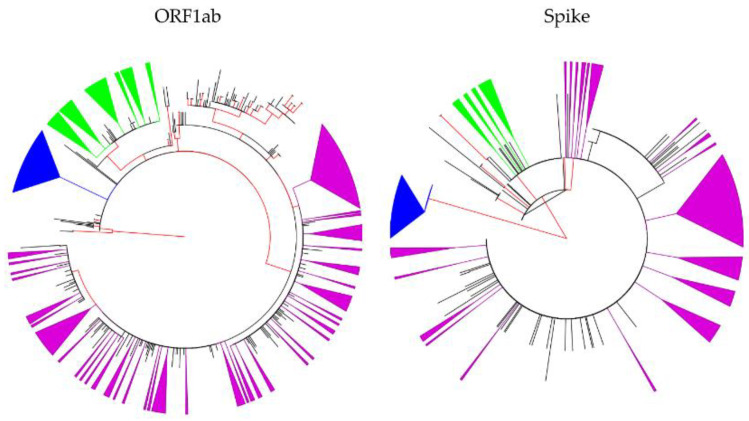
Figure 2.
Maximum likelihood (ML) phylogenetic trees constructed using SARS-CoV-2 sequences collected in Jordan. The ML tree to the left was constructed using ORF1ab region, while the ML tree to the right was constructed using the Spike region. Internal branches with approximate likelihood Shimodaira–Hasegawa (aLRT-SH) values of ≥0.90 are shown in red. The clustered first Jordan lineage (B.1.1.312) sequences are shown as collapsed purple triangles; the clustered second Jordan lineage (B.1.36.10) are shown as collapsed green triangles; and the clustered UK variant lineage (B.1.1.7) are shown as collapsed blue triangles; ORF: open reading frame.

