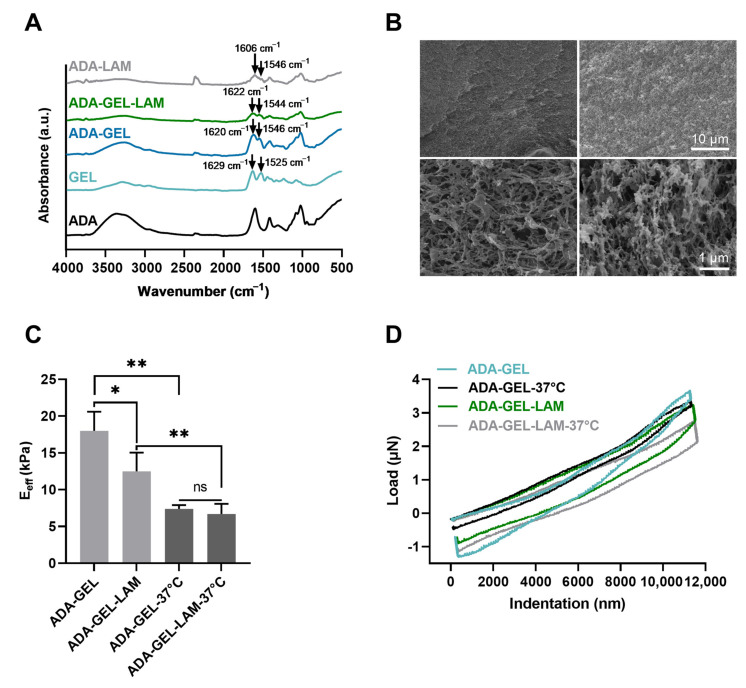
Figure 2.
Material characterization. (A) Fourier transformed infrared spectroscopy (FTIR) analysis, absorbance spectra of ADA, GEL, ADA-GEL, ADA-GEL-LAM, and ADA-GEL hydrogels. (B) Scanning electron microscopy images of ADA-GEL and ADA-GEL-LAM hydrogels. Both hydrogels feature micro porosity (bottom row). (C) Nanoindentation of ADA-GEL and ADA-GEL-LAM showing the effective Young’s modulus (Eeff) of the hydrogels at 22 °C and 37 °C. Data are displayed as mean ± SD. (D) Qualitative load-indentation behavior of the hydrogels. Statistically significant differences of means analyzed using one-way ANOVA with * p < 0.05, ** p < 0.01, not significant (ns, p ≥ 0.05). Scale bar 1–10 µm.

