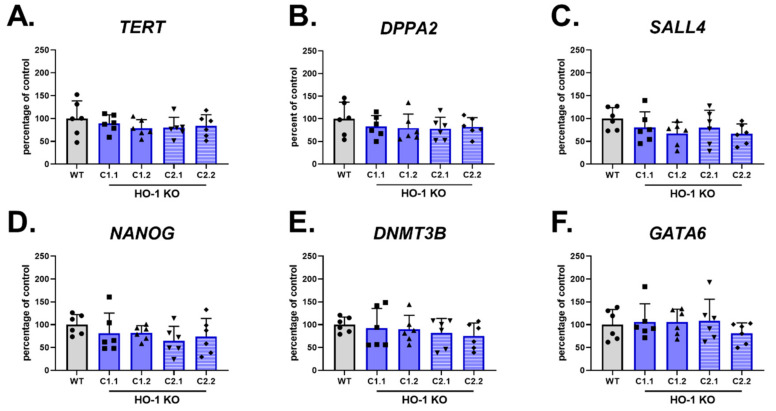
Figure 2.
Lack of HO-1 does not influence the level of GATA6 and pluripotency markers. qRT-PCR analysis of (A–E) pluripotency markers and (F) GATA6 in WT and HO-1 KO hiPSC.3. Expression was normalized to EEF-2 levels. Bars represent mean ± SD of N = 3 experiments. Dots, squares and triangles represent each replicate for corresponding groups, one-way ANOVA test.

