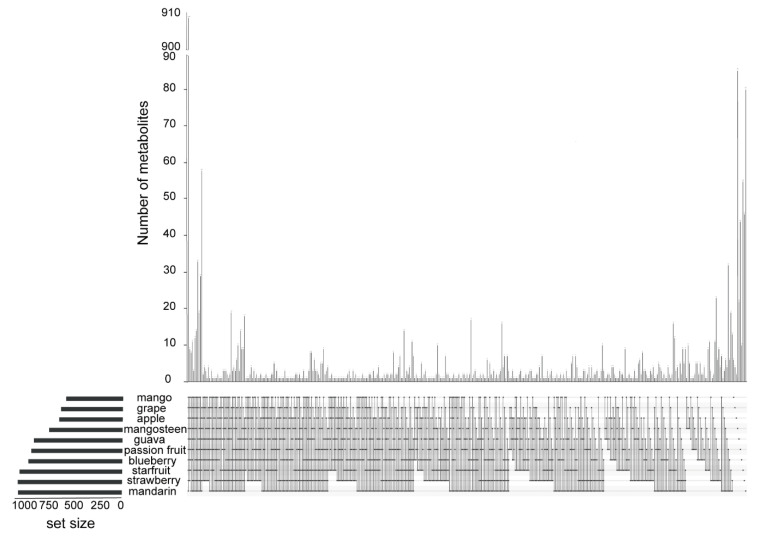
Figure 3.
An upset plot of the number of metabolites detected in ten kinds of fruits. Black dot(s) at the bottom of each vertical bar indicates the intersection, which is made up of fruits that share the same metabolite. The lined dots indicate that two or more fruits shared the same metabolites. The black vertical bars at the top of the diagram indicate the number of metabolites of the corresponding intersection. The total numbers of metabolites detected in each fruit are represented by horizontal bars on the left.

