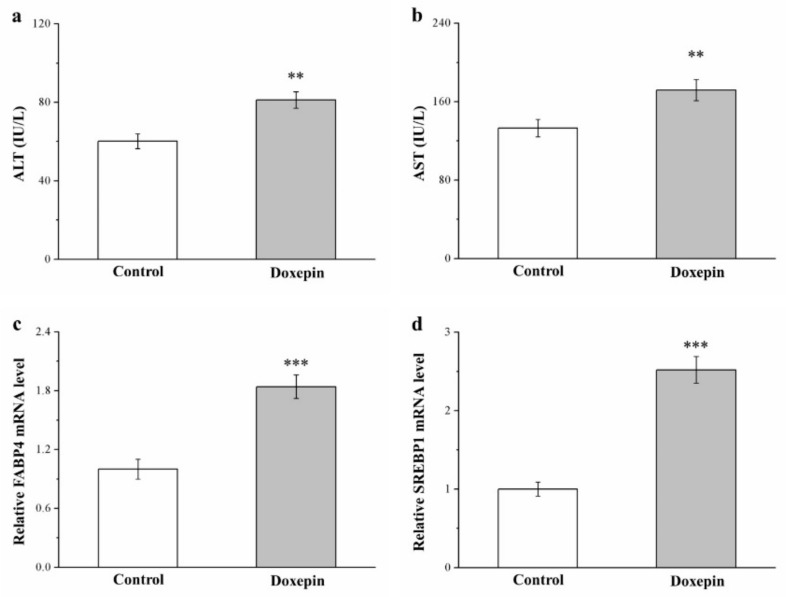
Figure 4.
Serum (a) ALT and (b) AST levels as well as liver (c) FABP4 and (d) SREBP1 mRNA levels in the control and doxepin treatment groups over 56 treatment days. All values represent means ± standard deviations (n = 10 for all groups). ** p < 0.01 and *** p < 0.001 indicate high and very high statistical significance, respectively.

