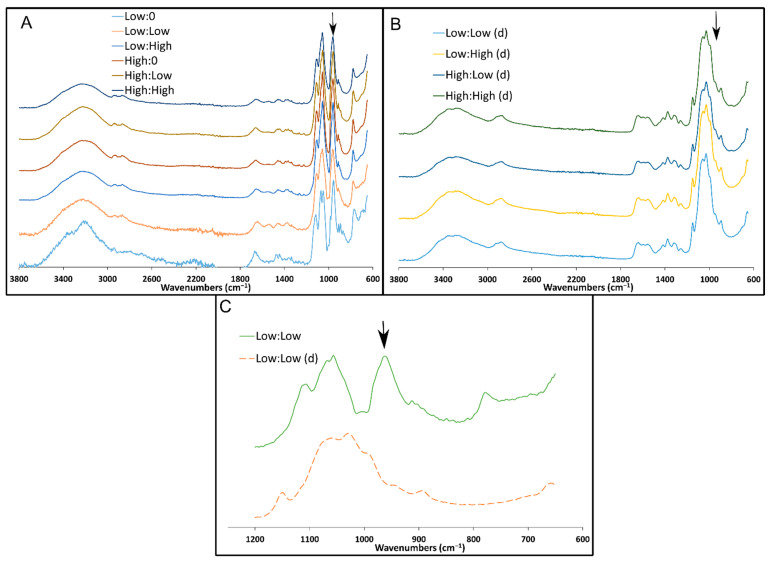
Figure 8.
FTIR spectra of freeze-dried CH gel samples containing 158 mg/mL (Low) β-GP or 212 mg/mL (High) β-GP with 0, 5, or 9 mg/mL FOS (labels are β-GP:FOS). (A) Non-degraded samples displayed a characteristic peak around 950 cm−1 (arrow) indicating FOS and β-GP. (B) Samples following 5 days of degradation (indicated by d). (C) Subset (1200 to 650 cm−1) of representative non-degraded (solid line) and degraded (dashed line) spectra. The degraded spectrum lacked the peak around 950 cm−1 (arrow), suggesting the release of FOS and β-GP.

