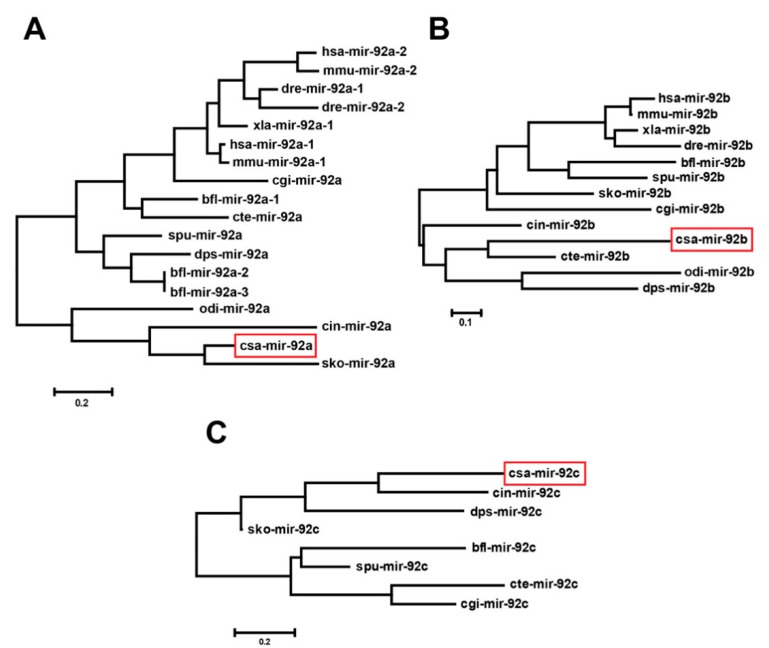
Figure 2.
The phylogenetic trees of miR-92 in different species. (A–C) Phylogenetic trees of the miR-92a (A), miR-92b (B), and miR-92c (C) precursor sequence by the Maximum Likelihood method. The red rectangles indicate csa-mir-92a, csa-mir-92b, and csa-mir-92c, respectively. Scale bar = 0.2 in (A,C) and 0.1 in (B).

