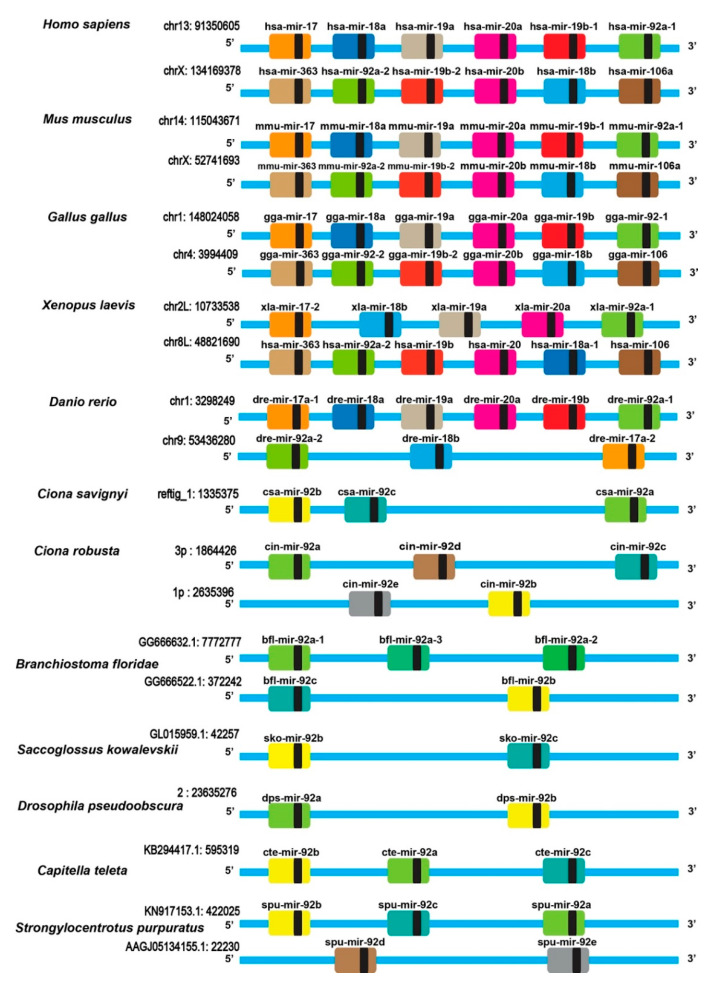
Figure 3.
The schematic diagram of the mir-17-92/mir-92 cluster in different species. Each larger-colored square represented a different miRNA. The smaller-black squares characterized the mature miRNAs. The blue line indicated the partial genome. The genomic location of the mir-17-92/mir-92 cluster gene was labeled on the left-top of the schematic diagram. The left rows are the name of the species.

