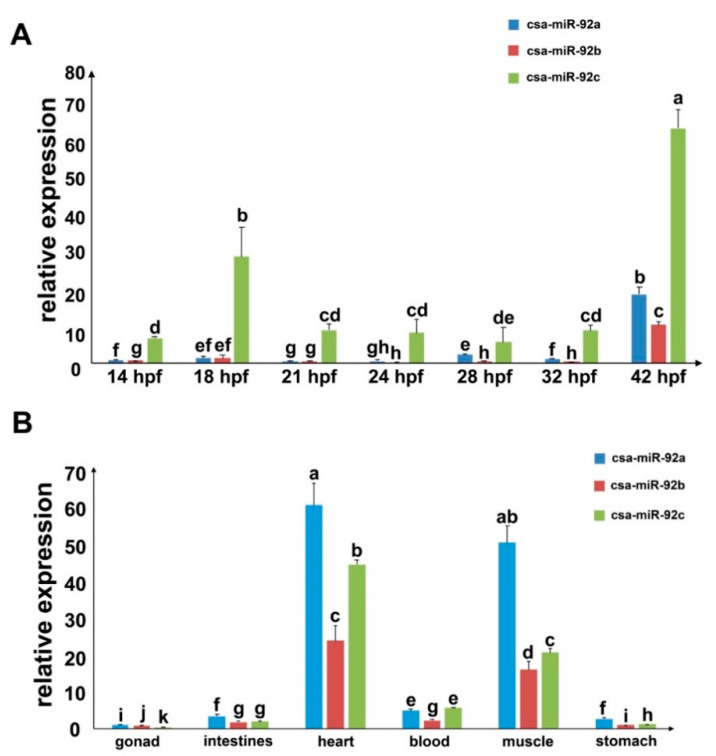
Figure 4.
Expression profiles of csa-miR-92 miRNAs. (A) Relative expression of csa-miR-92a, csa-miR-92b, and csa-miR-92c at different stages (14 hours postfertilization (hpf), 18 hpf, 21 hpf, 24 hpf, 28 hpf, 32 hpf, and 42 hpf). (B) Relative expression of csa-miR-92a, csa-miR-92b, and csa-miR-92c in various tissues (gonad, intestines, heart, blood, muscle, and stomach). The relative expression of each miRNA was calculated using the 2−ΔΔCt method and normalized to the U6 gene expression. Results represented the mean of triplicate assays with the standard error (mean ± SD). Significance (p < 0.05) was indicated by a, b, c, d, e, f, g, h, i, j, and k.

