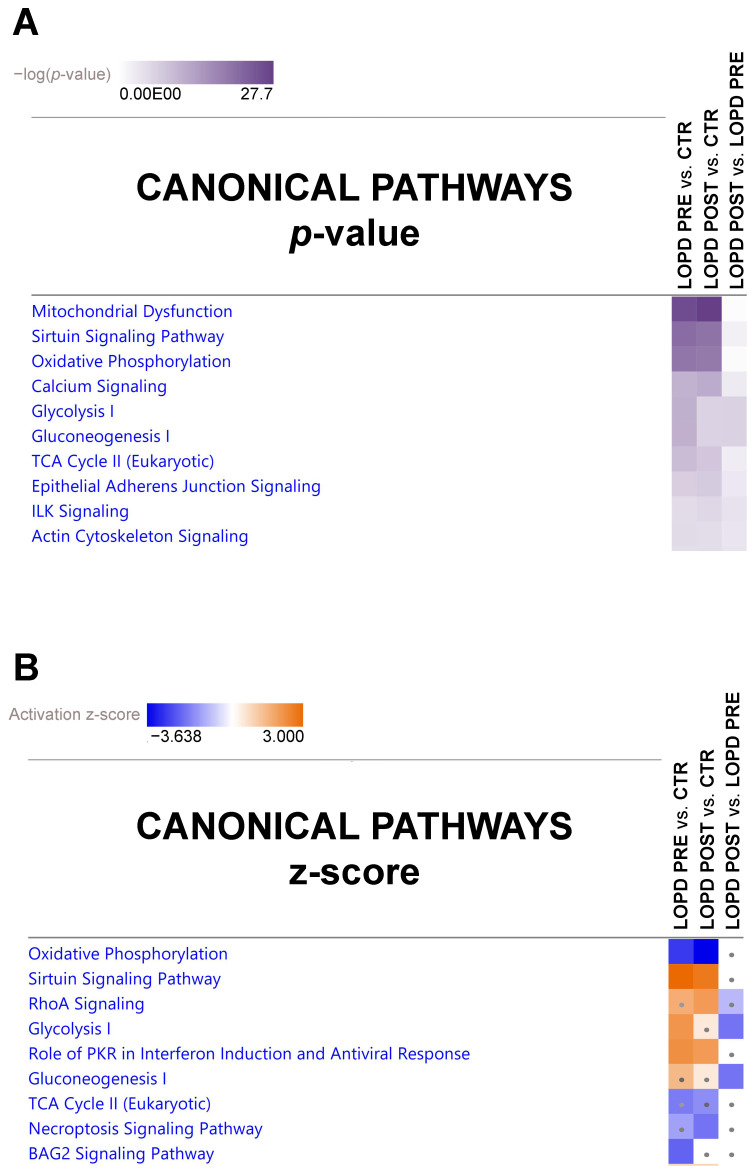
Figure 3.
Canonical pathway heatmap displaying the most significant results (p-value in panel (A) and z-scores in panel (B)) across datasets in LOPD PRE vs. CTR, LOPD POST vs. CTR. and LOPD POST vs. LOPD PRE. The orange and blue colored rectangles indicate predicted pathway activation or predicted inhibition, respectively, via the z-score statistic (z-score ≥ 2, ≤ −2). Dots are non-significant values for z-score.

