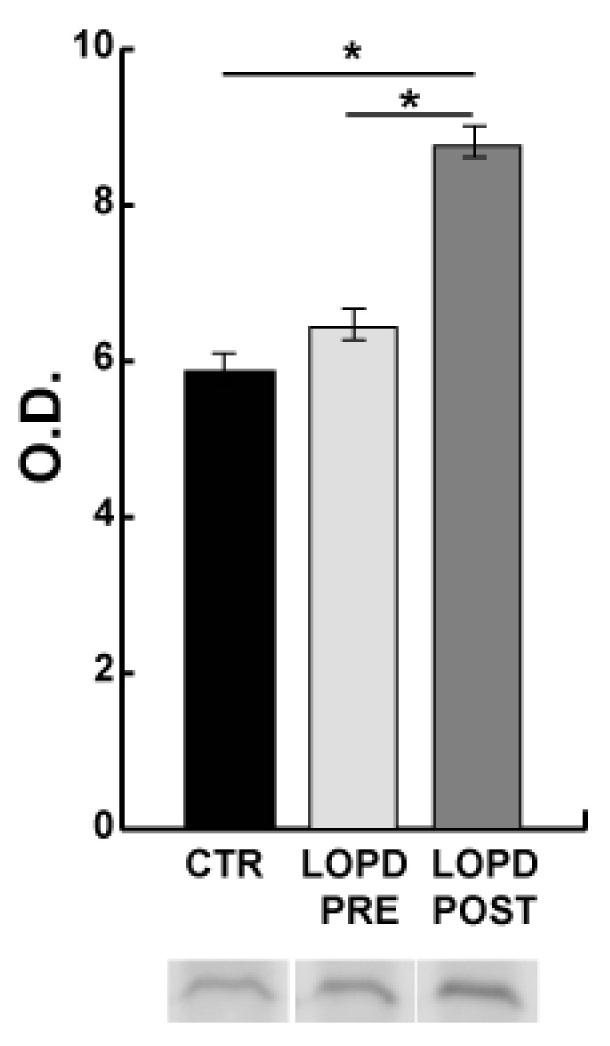
Figure 6.

Endoplasmic reticulum (ER) stress. Representative immunoblot images and histograms (mean ± SD) showing protein abundance of C/EBP-homologous protein (CHOP/DDIT3). The data were normalized against the total amount of loaded proteins stained with Sypro Ruby. Statistical analysis was performed by ANOVA and Tukey’s test (* p < 0.05). To improve visualization blot images have been cropped, full-length images are available in Supplementary material (Figure S2). O.D. = optical density.
