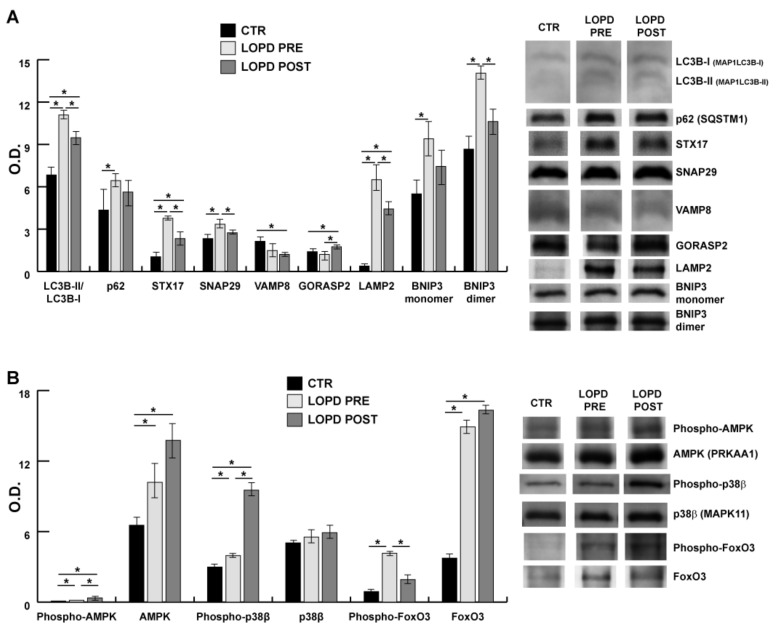
Figure 7.
Lysosomal autophagy and apoptosis. Representative immunoblot images (cropped images) and histograms (mean ± SD) showing protein abundance of: (A) microtubule associated protein 1 light chain 3 beta (LC3B/MAP1LC3B), ubiquitin-binding protein p62/sequestosome 1 (p62/SQSTM1), sintaxin 17 (STX17), synaptosomal-associated protein 29 kDa (SNAP29), endobrevin (VAMP8), Golgi reassembly-stacking protein 2 (GORASP2), lysosome-associated membrane protein 2 (LAMP2), BCL2/adenovirus E1B 19 kDa protein-interacting protein 3 (BNIP3) in CTR, pre- and post-ERT LOPD; and (B) protein kinase AMP-activated catalytic subunit alpha 1 (AMPK/PRKKA1), p38 mitogen-activated protein kinases 11 (p38β/MAPK11), and fork head box O3 (FoxO3) in CTR, LOPD PRE and LOPD POST. The data were normalized against the total amount of loaded proteins stained with Sypro Ruby. Statistical analysis was performed by ANOVA and Tukey’s test (* p < 0.05). Blot images have been cropped for a better visualization, full-length images are available in Supplementary Material (Figure S2). O.D. = optical density.

