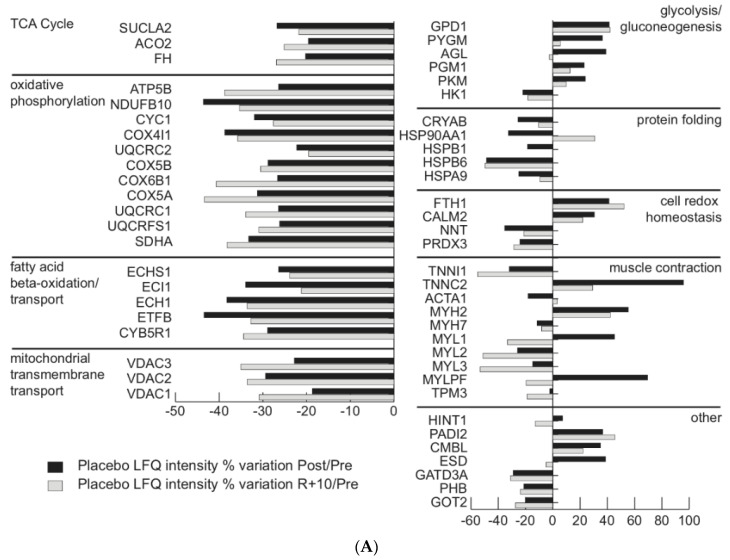
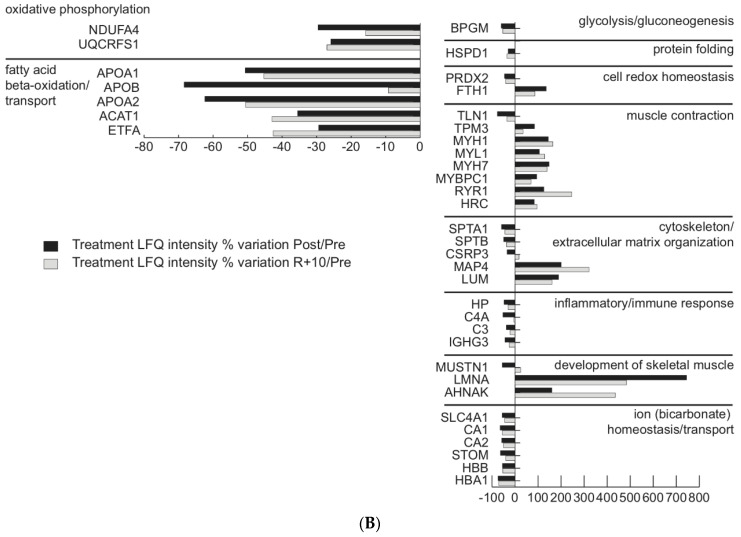
Figure 1.
(A) Proteomic analysis of vastus lateralis (VL) muscles in the Placebo group. Histograms of differentially expressed proteins (label-free quantification (LFQ), intensity % variation, ANOVA and Tukey’s test, n = 5, p ≤ 0.05) in bedrest Placebo-Post (black bars) and Placebo-R + 10 subjects (gray bars) vs. Placebo-Pre condition. The individual variability within the group (Pre, Post, and R + 10) is shown in Figure S1. (B) Proteomic analysis of VL muscles in the Treatment group. Histograms of differentially expressed proteins (LFQ intensity % variation, ANOVA and Tukey’s test, n = 5, p ≤ 0.05) in bedrest Treatment-Post (black bars) and Treatment-R + 10 subjects (gray bars) vs. Treatment-Pre condition. The individual variability within the group (Pre, Post, and R + 10) is shown in Figure S2.


