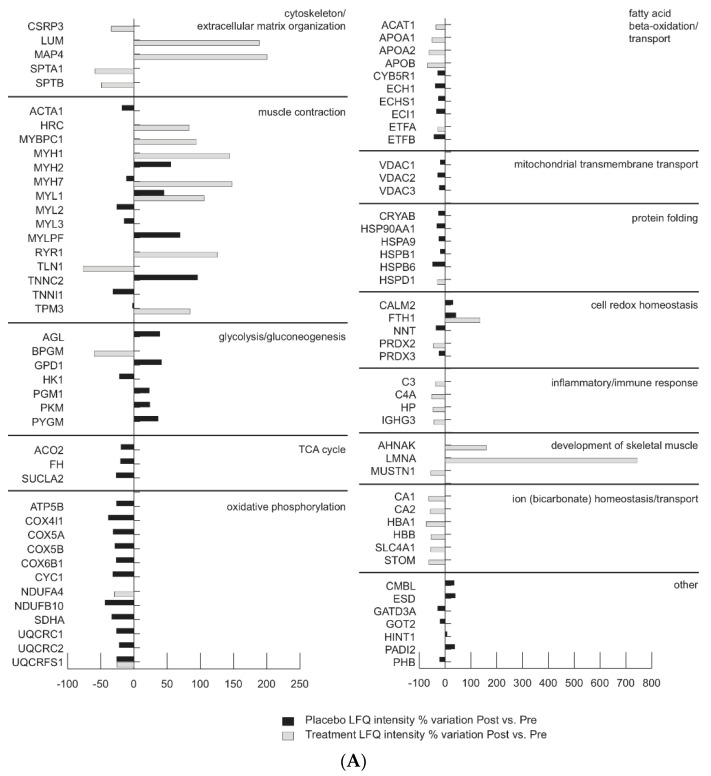
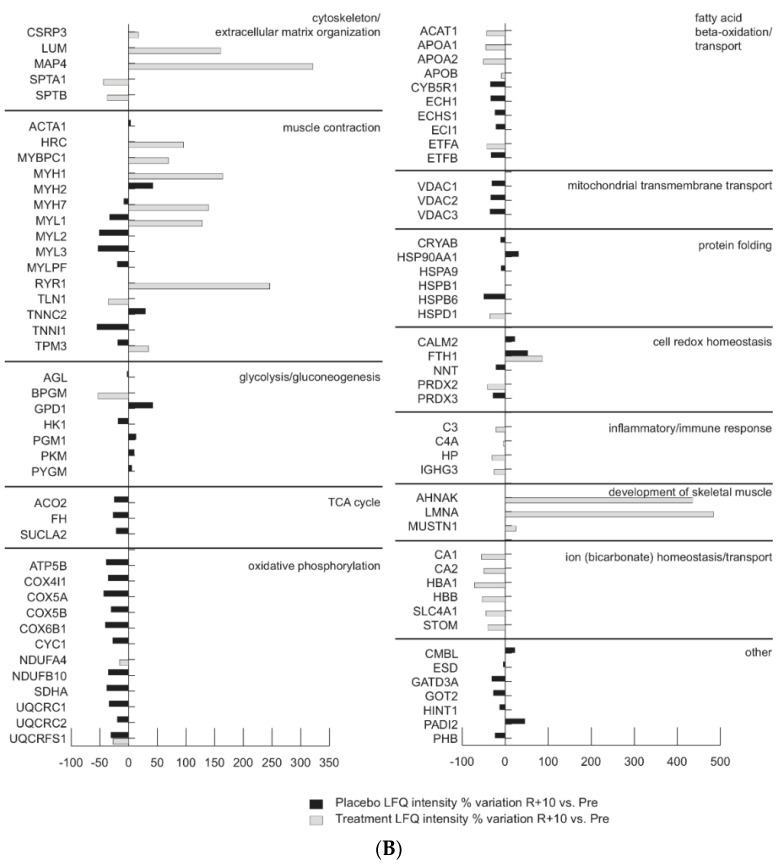
Figure 2.
(A) Comparison of Placebo (black bars) and Treatment (gray bars) proteomic datasets in bedrest Post vs. Pre condition (LFQ intensity % variation, ANOVA and Tukey’s test, n = 5, p < 0.05). (B) Comparison of Placebo (black bars) and Treatment (gray bars) proteomic datasets in bedrest R+10 vs. Pre condition (LFQ intensity % variation, ANOVA and Tukey’s test, n = 5, p < 0.05).


