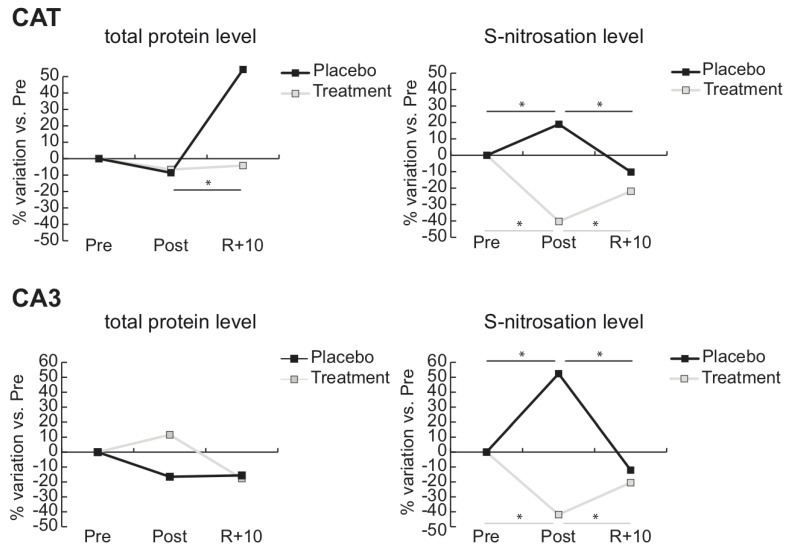
Figure 4.
Total abundance and S-nitrosated protein level of catalase (CAT) and carbonic anhydrase 3 (CA3). Line charts illustrating protein abundance and S-nitrosation level variations (%) of cytosolic proteins catalase (CAT) and carbonic anhydrase 3 (CA3) in post-bedrest (Post) and recovery (R + 10) compared to pre-bedrest (Pre) condition in untreated controls (Placebo, black lines) or in subjects under antioxidant treatment (Treatment, gray lines) (* = significant difference, ANOVA and Tukey, n = 5, p-value ≤ 0.05).

