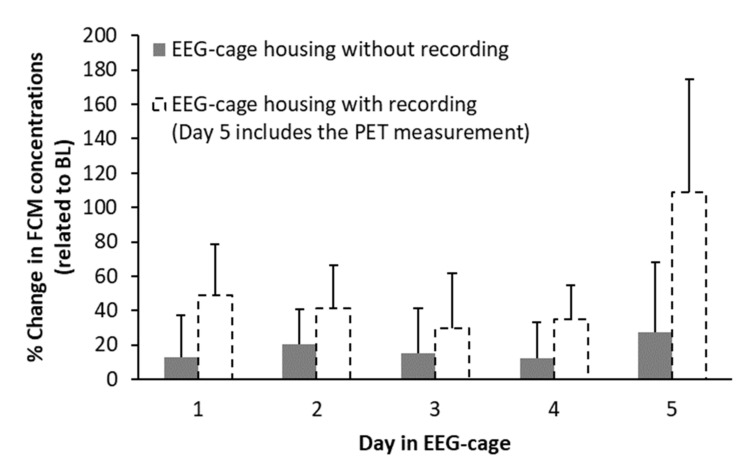
Figure 6.
Difference (% change) in fecal corticosterone metabolite (FCM) concentrations during electro-encephalographic (EEG-) cage housing without EEG-recording related to baseline (BL) values (control group, n = 8). For comparison, dotted columns depict FCM levels of rats with EEG-recording and a positron emission tomography (PET) measurement at Day 5 (test group, n = 7). Error bars denote standard deviation.

