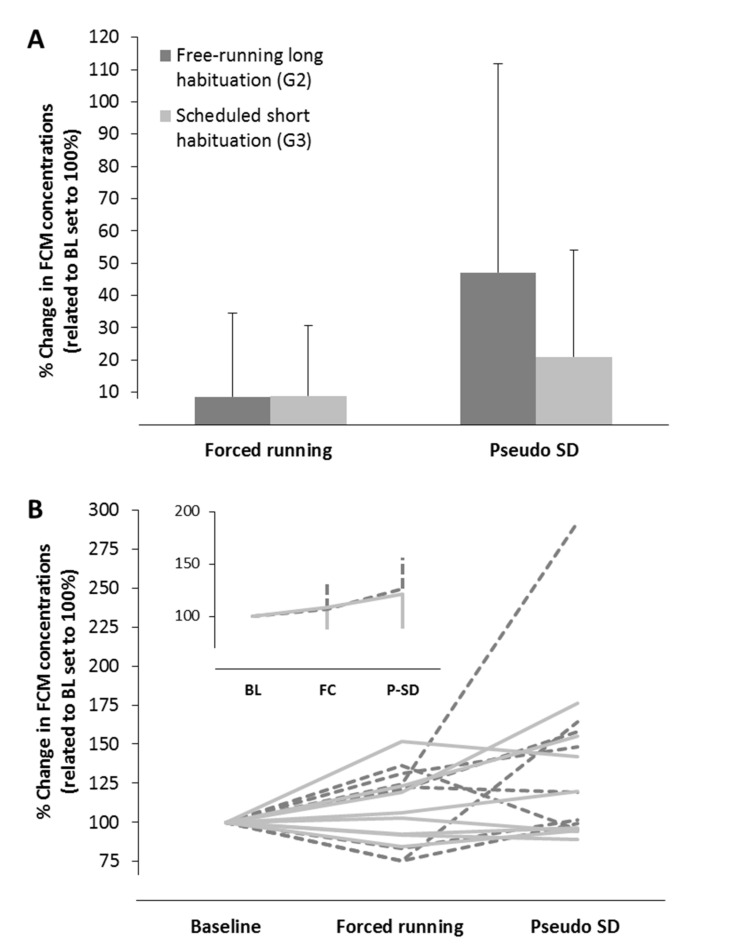
Figure 7.
Percentage differences in concentrations of fecal corticosterone metabolites (FCMs) related to baseline (BL) values in rats with a free-running long habituation (n = 8) and in rats with a scheduled short habituation (n = 8) to activity wheels. Forced running (FC) represents housing in activity wheels during the active period (lights off) whereas pseudo-sleep deprivation (P-SD) depicts housing during the inactive period (lights on). Error bars denote standard deviations. (A) Mean differences in FCMs of all animals per group (n = 8 each). (B) Individual FCM courses of all animals. Dotted dark lines represent animals with long free-running habituation to the activity wheels; solid light lines depict animals with short scheduled habitation to the activity wheels. Note that one animal with the long free-running habituation showed an extreme increase in FCM levels during pseudo-SD. Insert represents mean FCM concentrations at the different timepoints in both groups after exclusion of this animal.

