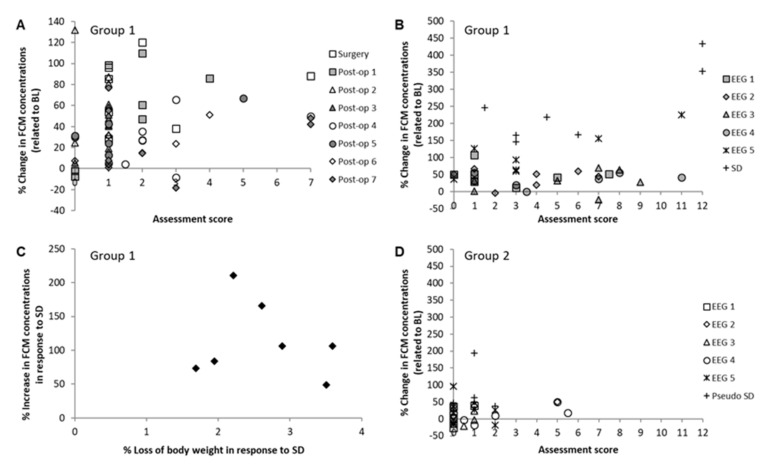
Figure 8.
Relationship between changes in fecal corticosterone metabolite (FCM) concentrations and parameters of welfare assessment. Each category of symbols represents one day, and each symbol by itself depicts the score of one individual animal. All sleep deprivation (SD) and pseudo-SD FCM values were corrected for circadian variation. (A) Overall assessment scores determined on the basis of standardized score sheets in relation to changes in FCM levels during the one-week post-operative period after electroencephalograph (EEG) electrode implantation (test group G1, n = 7). (B) Overall assessment scores determined on the basis of standardized score sheets in relation to changes in FCM levels during EEG-recordings and SD in activity wheels (AW) (test group G1, n = 7). (C) Loss of body weight and increase in FCMs due to SD. Each symbol represents data of one animal. Increase in FCMs and loss of body weight were related to values determined directly before SD (test group G1, n = 7). (D) Overall assessment scores determined on the basis of standardized score sheets in relation to changes in FCMs during EEG-cage housing without EEG-recordings and pseudo-SD in AWs (control group G2, n = 6).

