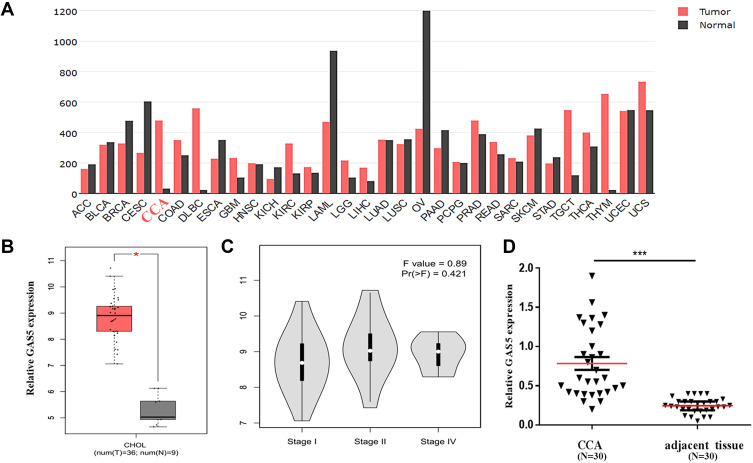
Figure 1.
Clinical expression of GAS5 in CCA patients. (A) The expression profile of GAS5 by bioinformatics analysis according to the GEPIA database. (B) Differential expression of GAS5 between CCA and healthy tissues based on the GEPIA database. *p<0.05. (C) Differential expression of GAS5 in stage I, stage II and stage IV of CCA. (D) qRT-PCR was applied to detect the differential expression of GAS5 in CCA tissues and adjacent tissues, ***p<0.001.

