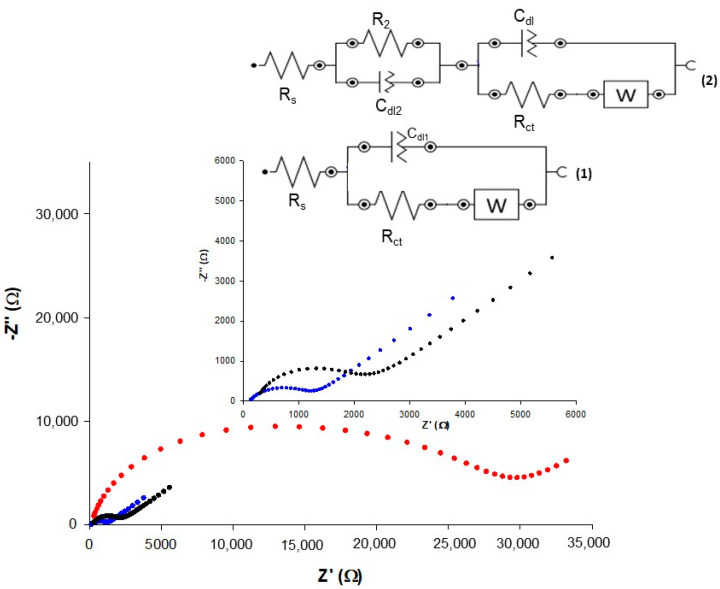
Figure 4.
EIS response (Nyquist plots) of Au bare (blue curve), Au/SAMCys/OLNPs (black curve) and Au/KLNPs (red curve). The inset shows a magnification of blue and black curves and equivalent circuits used for fitting the experimental data, where (1) was used for Au bare and (2) for both modified electrodes. Experimental conditions: 5 mM Fe(CN)63−/Fe(CN)64− in PBS buffer (pH = 7.4) at 103 Hz.

