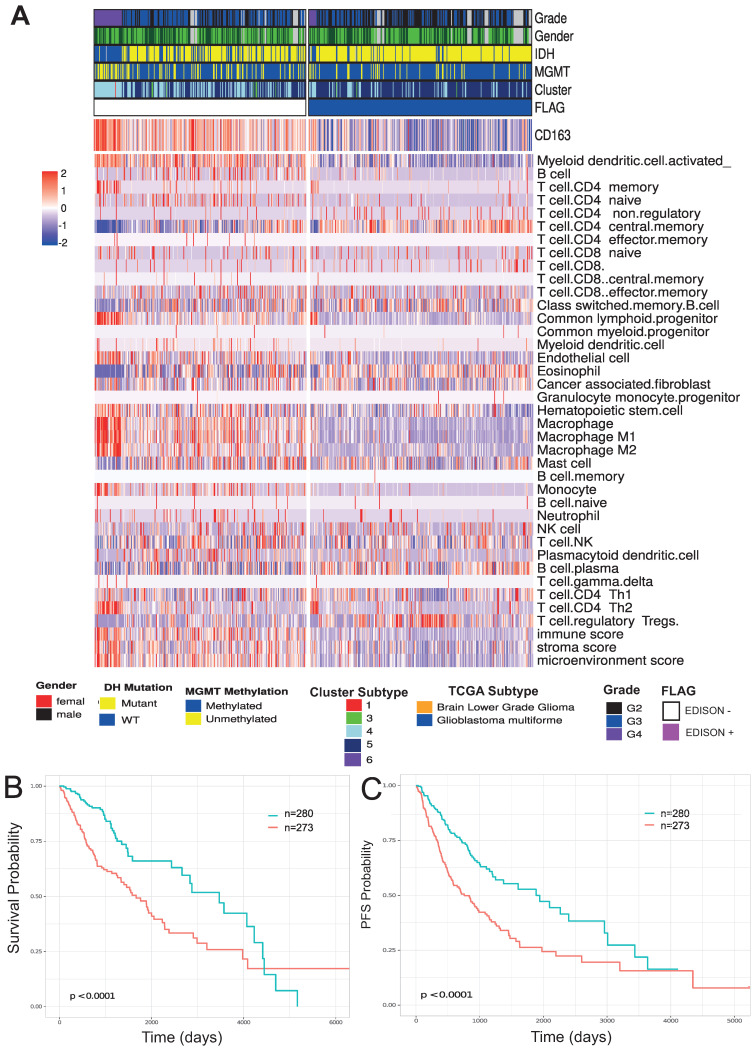
Figure 2.
Immune landscape of glioma patients. (A) Heatmap of immune signature computed on glioma cohorts from the TCGA study. The signature was calculated using immunodeconv (xCell) and the expression of gene CD163. The mutational status and immuno subtype are reported. (B) Kaplan–Meier survival curves showing OS interval based on the previously calculated flag on TCGA glioma patients. Time is reported in days. (C) Kaplan–Meier survival curves showed progression-free survival (PFS) intervals based on the previously calculated flag on TCGA glioma patients. Time is reported in days.

