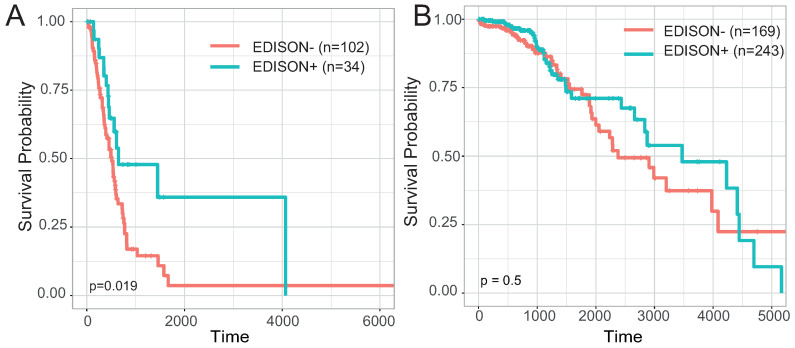
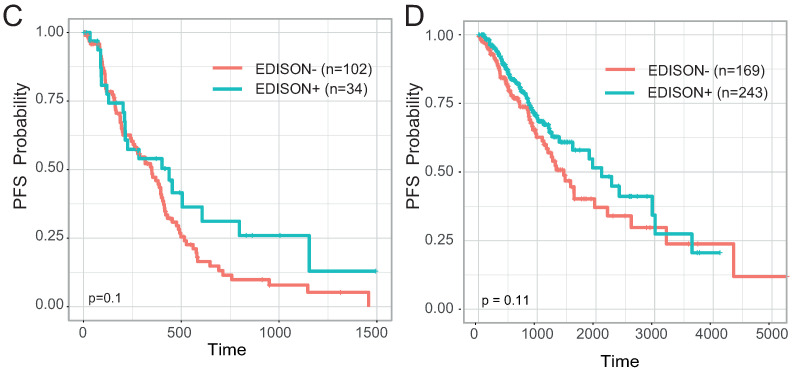
Figure A1.
(A) Kaplan–Meier survival curves showing OS interval based on the previously calculated flag on TCGA glioma patients with IDH wild-type status. Time is reported in days. (B) Kaplan–Meier survival curves showing OS intervals based on the previously calculated flag on TCGA glioma patients with IDH mutated. Time is reported in days. (C) Kaplan–Meier survival curves showing PFI interval based on the previously calculated flag on TCGA glioma patients. with IDH wild-type status. Time is reported in days. (D) Kaplan–Meier survival curves showing PFS intervals based on the previously calculated flag on TCGA glioma patients with IDH mutated. Time is reported in days.


