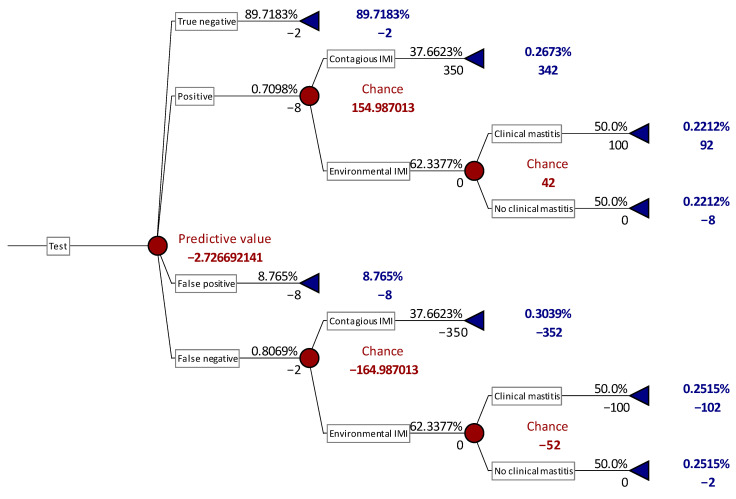
Figure 1.
Decision tree example based on SCC cut-off of 400,000 cells/mL for major pathogens IMI detection in primiparous. Epidemiological and diagnostic performances are the same of this study and input values are reported in Material and Methods section. Numbers alone (red or blue character) represent costs (€), while numbers followed by % represent the probability of the status described in each line of the graph.

