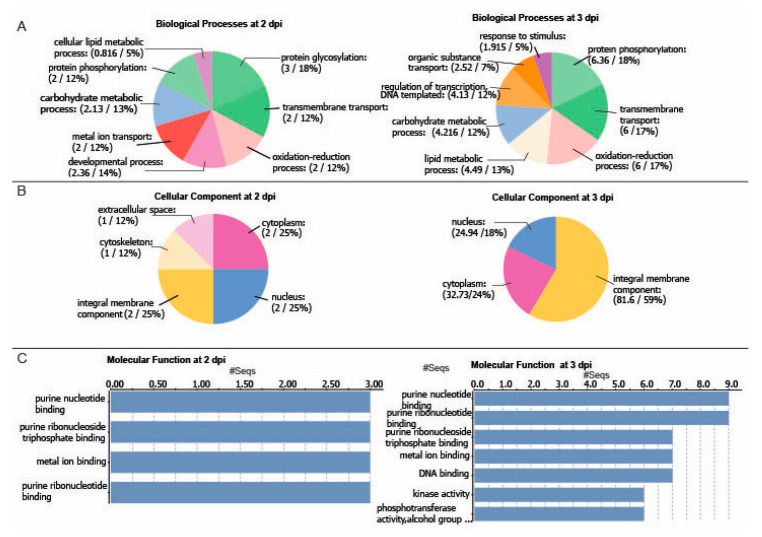
Figure 3.
Summary pie charts and bar charts of GO analysis of DEGs that are downregulated transcripts at 2 and 3 dpi. The charts show the distribution of sequences according to the GO terms affiliated with (A) biological processes, (B) cellular components, and (C) molecular functions. The numbers and percentages of sequences are presented in parentheses with each slice in the pie charts.

