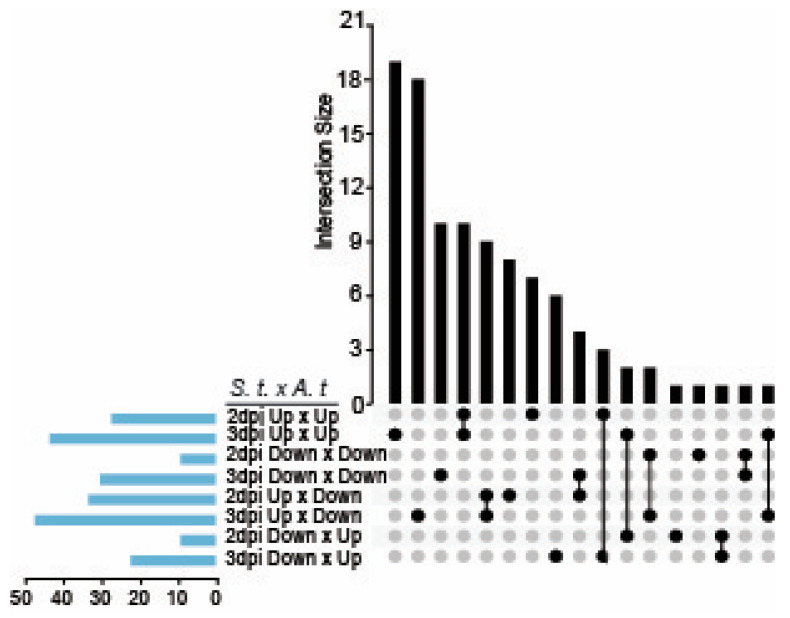
Figure 7.
Functional characterization of UPR related genes in S. tuberosum DEGs. The UpSet plot shows potato DEGs (2 dpi and 3 dpi) that were also represented in a published Arabidopsis UPR DEGs dataset obtained following induction by tunicamycin (5 µg/mL) [58]. S.t. x A.t is shorthand for S. tuberosum by Arabidopsis comparison indicating DEGs that are upregulated or downregulated in both datasets or alternatively up and down regulated in each dataset.

