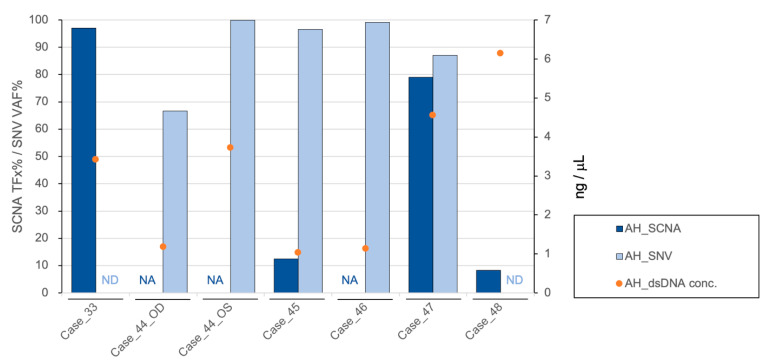
Figure 1.
Diagnostic information from AH liquid biopsy with graph showing the tumor fraction (TFx) of SCNA (dark blue bar), variant allele frequency (VAF) of RB1 SNV (light blue bar), and cfDNA quantification (orange dots) for each case’s AH sample at time of diagnosis. NA: not available; ND: not detected.

