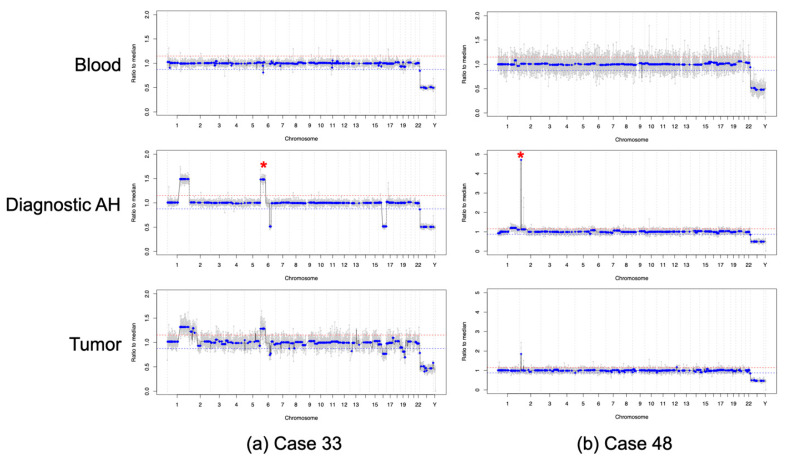
Figure 3.
Prognostic information from AH liquid biopsy. Genomic profiles from the blood, AH sample at time of diagnosis, and tumor tissue at time of enucleation for (a) Case 33, asterisk showing 6p gain with an amplitude of 1.5 ratio to the median and (b) Case 48, asterisk showing MYCN amplification. Genomic profiles from the blood were without SCNAs, compared to the genomic profiles from the AH at time of diagnosis, which were highly concordant with those obtained from the tumor tissue. Due to admixing with normal retinal tissue, SCNAs from tumor tissue may show lower amplitude compared to AH due to diluted TFx.

