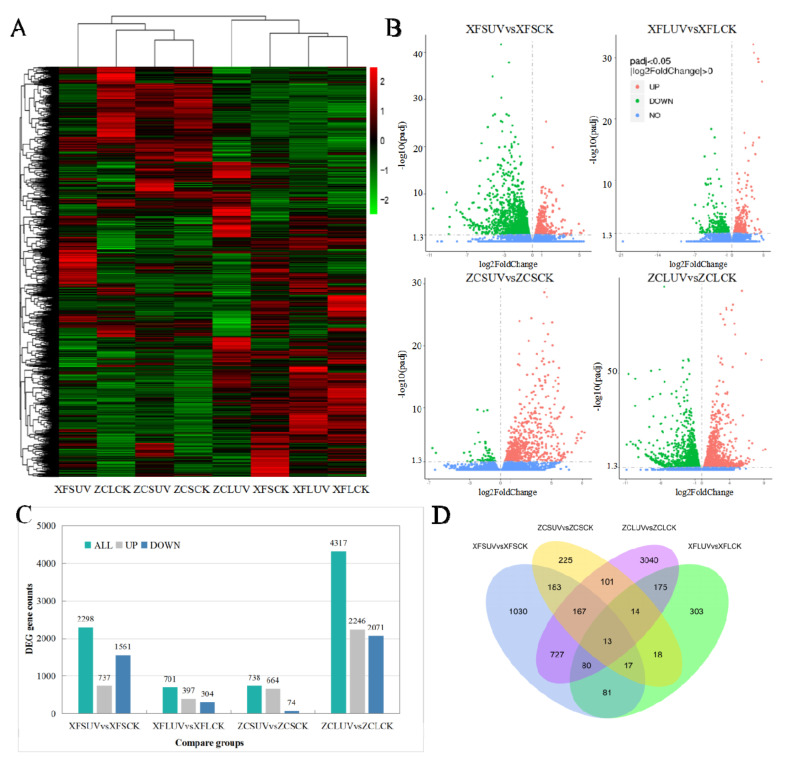
Figure 2.
Differentially expressed genes (DEGs) of different compare groups. (A) Comparison of the transcription level of DEGs. (B) Volcano map for the significance level of the DEGs. The horizontal axis represents the fold change of DEGs, and the vertical axis represents the significance level of the difference. Padj indicates the corrected p value after the multiple hypothesis test, the same as below. (C) Comparison of the DEG numbers in different comparison groups. (D) The number of shared or specific DEGs between different comparison groups. XFSUV/XFSCK indicates ‘Xiangfei’ under short-term UV-C/control conditions. XFLUV/XFLCK indicates ‘Xiangfei’ under long-term UV-C/control conditions. ZCSUV/ZCSCK indicates ‘Zicui’ under short-term UV-C/control conditions. ZCLUV/ZCLCK means ‘Zicui’ under long-term UV-C/control condition vs. means the change of the former relative to the latter. The same as below.

