Table 4.
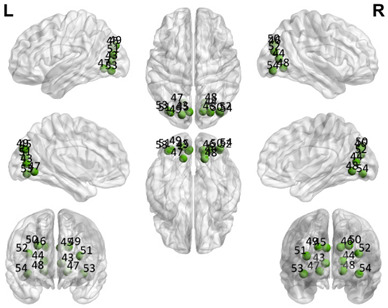
Descriptions of the observed distributions of the complexity indicators in each group in the five subnetworks and the entire network that make up the DMN and their distribution according to the AAL atlas. The number of ROIs coincides with the description in Table 1. SD: standard deviation. DMN partial network (6 ROIs). DMN partial network (6 ROIs).
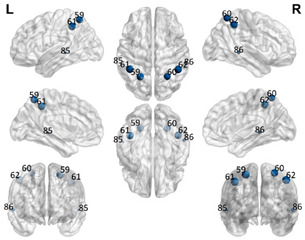
|
Network Indicators | DS Group | Control Group | ||
| Mean | SD | Mean | SD | ||
| Number of communities | 2.23 | 0.922 | 0.001 | 0.0001 | |
| Mean of the weighted path | 0.496 | 0.193 | 0.12 | 0.02 | |
| Standard deviation of the weighted path | 0.276 | 0.146 | 0.06 | 0.01 | |
| Density | 0.768 | 0.101 | 0.001 | 0.0001 | |
| Small-worldness | 1.027 | 0.088 | 0.0001 | 0.0001 | |
| Global clustering coefficient | 0.317 | 0.006 | 0.001 | 0.0001 | |
| Complexity | 0.822 | 0.238 | 0.11 | 0.02 | |
| Segregation (triangles) | 105.136 | 90.590 | 104.66 | 22.31 | |
| DMN Anterior (DMNa) partial network (6 ROIs) | |||||
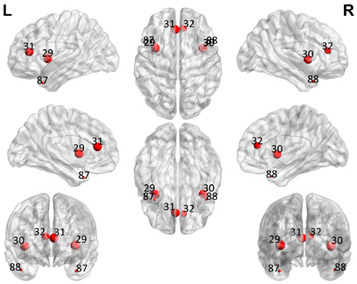
|
Network Indicators | DS Group | Control Group | ||
| Mean | SD | Mean | SD | ||
| Number of communities | 2.41 | 0.194 | 0.21 | 0.04 | |
| Mean of the weighted path | 0.423 | 0.043 | 0.10 | 0.02 | |
| Standard deviation of the weighted path | 0.299 | 0.027 | 0.05 | 0.01 | |
| Density | 0.768 | 0.021 | 0.0001 | 0.0001 | |
| Small-worldness | 1.027 | 0.018 | 0.0001 | 0.0001 | |
| Global clustering coefficient | 0.318 | 0.001 | 0.0001 | 0.0001 | |
| Complexity | 0.868 | 0.046 | 0.11 | 0.02 | |
| Segregation (triangles) | 109.181 | 18.035 | 103.14 | 21.98 | |
| DMN Ventral (DMNv) partial network (12 ROIs) | |||||
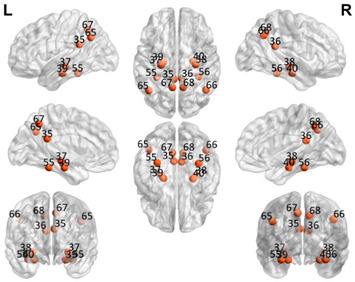
|
Network Indicators | DS Group | Control Group | ||
| Mean | SD | Mean | SD | ||
| Number of communities | 2.409 | 0.107 | 0.59 | 0.12 | |
| Mean of the weighted path | 0.605 | 0.033 | 0.08 | 0.01 | |
| Standard deviation of the weighted path | 0.232 | 0.029 | 0.03 | 0.01 | |
| Density | 0.454 | 0.001 | 0.001 | 0.001 | |
| Small-worldness | 1.240 | 0.014 | 0.05 | 0.01 | |
| Global clustering coefficient | 0.316 | 0.001 | 0.001 | 0.001 | |
| Complexity | 0.871 | 0.031 | 0.071 | 0.0001 | |
| Segregation (triangles) | 209.818 | 38.25 | 209.27 | 44.61 | |
| Sensorimotor (SM) partial network (12 ROIs) | |||||
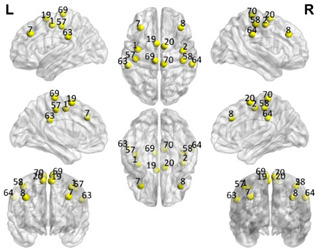
|
Network Indicators | DS Group | Control Group | ||
| Mean | SD | Mean | SD | ||
| Number of communities | 2.545 | 0.108 | 0.49 | 0.10 | |
| Mean of the weighted path | 0.677 | 0.027 | 0.08 | 0.01 | |
| Standard deviation of the weighted path | 0.202 | 0.032 | 0.22 | 0.04 | |
| Density | 0.454 | 0.001 | 0.001 | 0.001 | |
| Small-worldness | 1.230 | 0.013 | 0.07 | 0.01 | |
| Global clustering coefficient | 0.313 | 0.007 | 0.003 | 0.0008 | |
| Complexity | 0.884 | 0.027 | 0.06 | 0.001 | |
| Segregation (triangles) | 217.090 | 37.303 | 208.28 | 44.40 | |
| Visual (VIS) partial network (12 ROIs) | |||||
|
Network Indicators | DS Group | Control Group | ||
| Mean | SD | Mean | SD | ||
| Number of communities | 2.500 | 0.109 | 0.35 | 0.07 | |
| Mean of the weighted path | 0.783 | 0.016 | 0.07 | 0.01 | |
| Standard deviation of the weighted path | 0.115 | 0.009 | 0.04 | 0.009 | |
| Density | 0.454 | 0.001 | 0.0001 | 0.0001 | |
| Small-worldness | 1.271 | 0.011 | 0.06 | 0.001 | |
| Global clustering coefficient | 0.316 | 0.005 | 0.002 | 0.0006 | |
| Complexity | 0.930 | 0.011 | 0.04 | 0.008 | |
| Segregation (triangles) | 220.001 | 37.549 | 199.05 | 42.43 | |
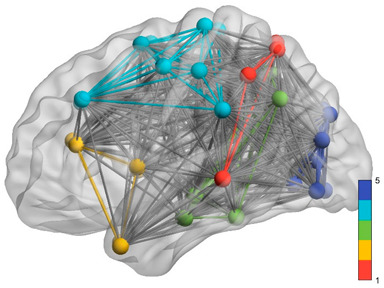
| GLOBAL NETWORK ANALYSIS (48 ROIs) | |||||
|
Network Indicators | DS Group | Control Group | ||
| Mean | SD | Mean | SD | ||
| Number of communities | 4.863 | 0.257 | 1.184 | 0.25 | |
| Mean of the weighted path | 0.690 | 0.022 | 0.07 | 0.01 | |
| Standard deviation of the weighted path | 0.248 | 0.030 | 0.08 | 0.01 | |
| Density | 0.152 | 0.020 | 0.001 | 0.0001 | |
| Small-worldness | 2.483 | 0.090 | 0.17 | 0.03 | |
| Global clustering coefficient | 0.312 | 0.001 | 0.001 | 0.0003 | |
| Complexity | 0.724 | 0.0617 | 0.03 | 0.008 | |
| Segregation (triangles) | 865,76 | 201.190 | 837.19 | 178.49 | |
Purple: visual. Blue: sensorimotor. Green: ventral DMN (DMNv). Yellow: anterior DMN (DMNa). Red: DMN.
