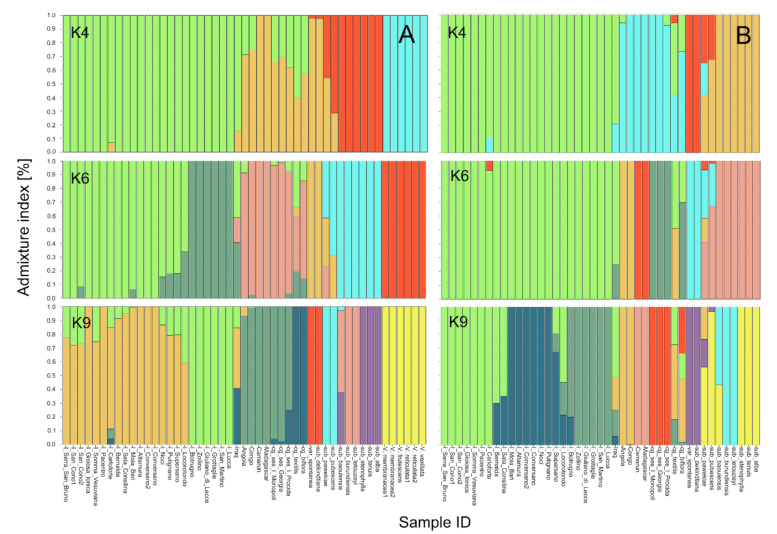
Figure 2.
Population structure analysis of the Vigna germplasm used in this study. K4, K6, K9 barplots for the whole Vigna germplasm (A) and for the V. unguiculata accessions (B). Numbers on the y-axis indicate the estimated membership coefficient (q). Accession names are shown at the bottom of the figure. The different colors of the bars indicate the groups formed at the different K values.

