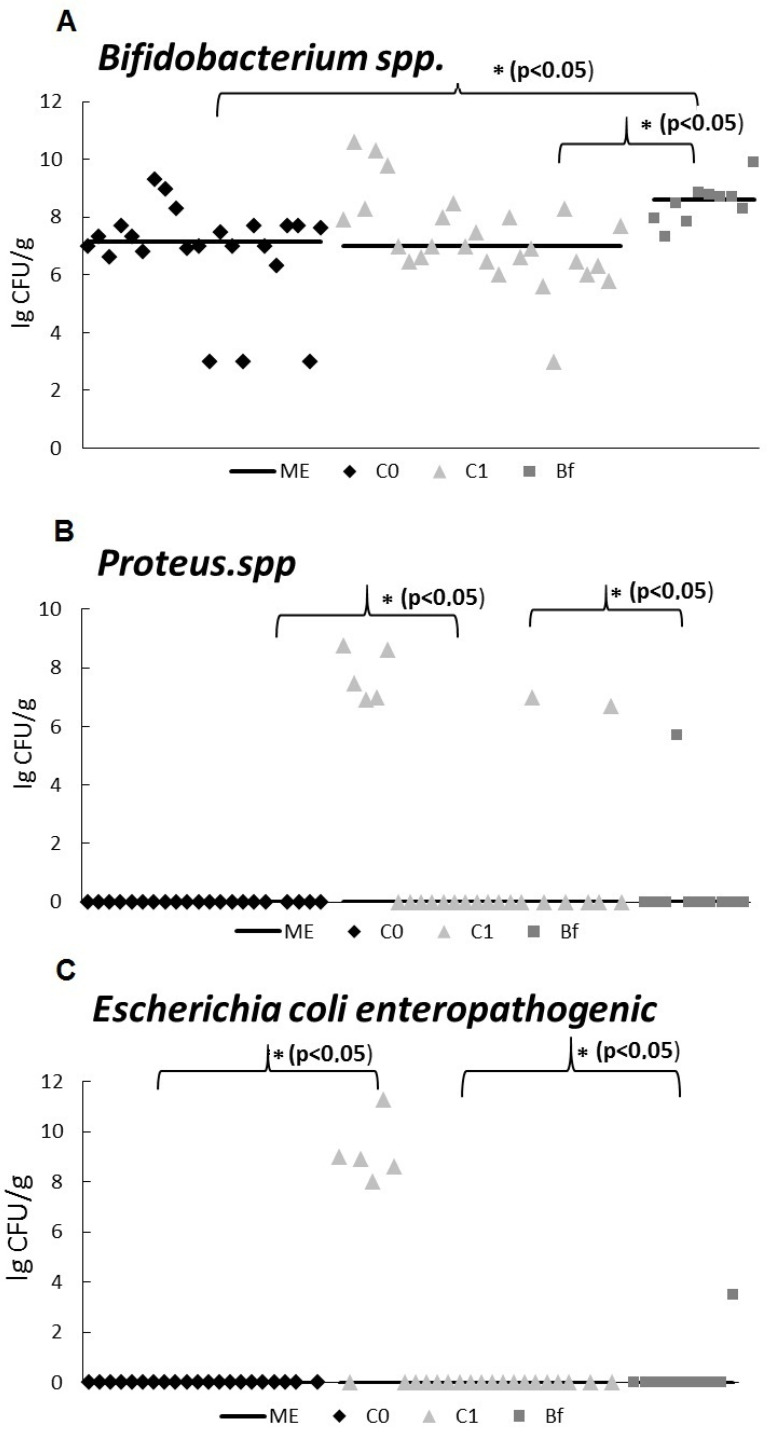
Figure 4.
Quantitative content of marker bacteria in the fecal samples in a rat model of antibiotic-associated dysbiosis. The rat groups: C0 (control)—without the introduction of antibiotics and autoprobiotics, C1—without the introduction of autoprobiotics after the withdrawal of antibiotics, Bf—with the introduction of indigenous bifidobacteria after the withdrawal of antibiotics. (A–C) ME—median. Mann–Whitney U test, * p < 0.05.

