Figure 1.
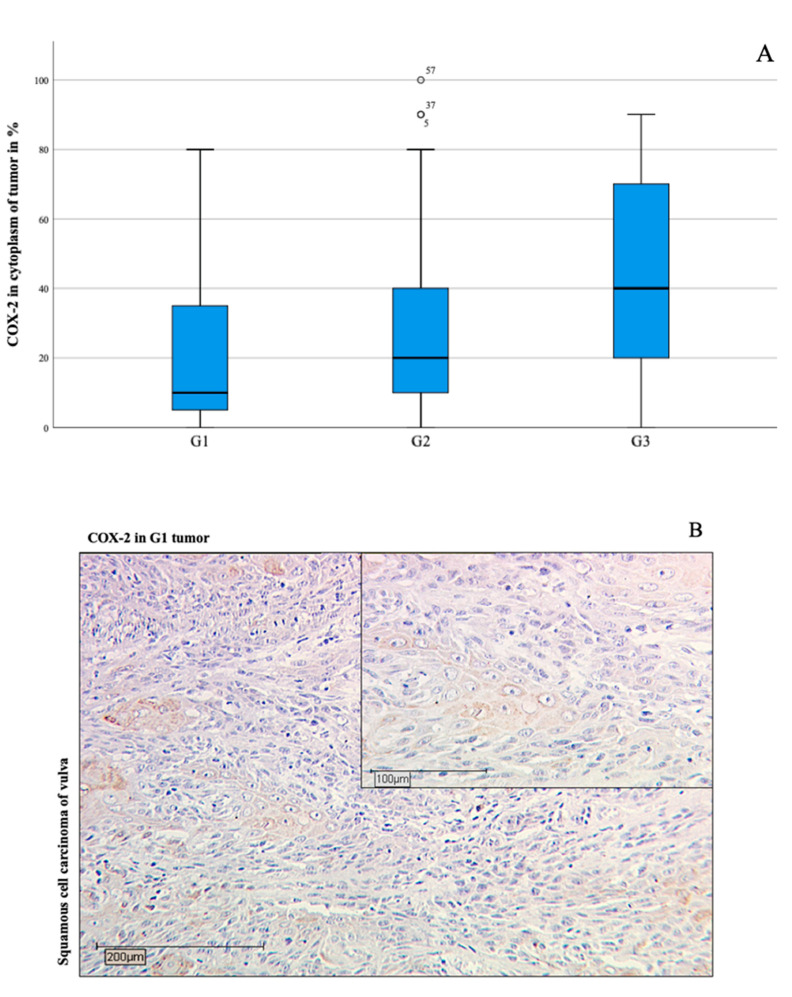
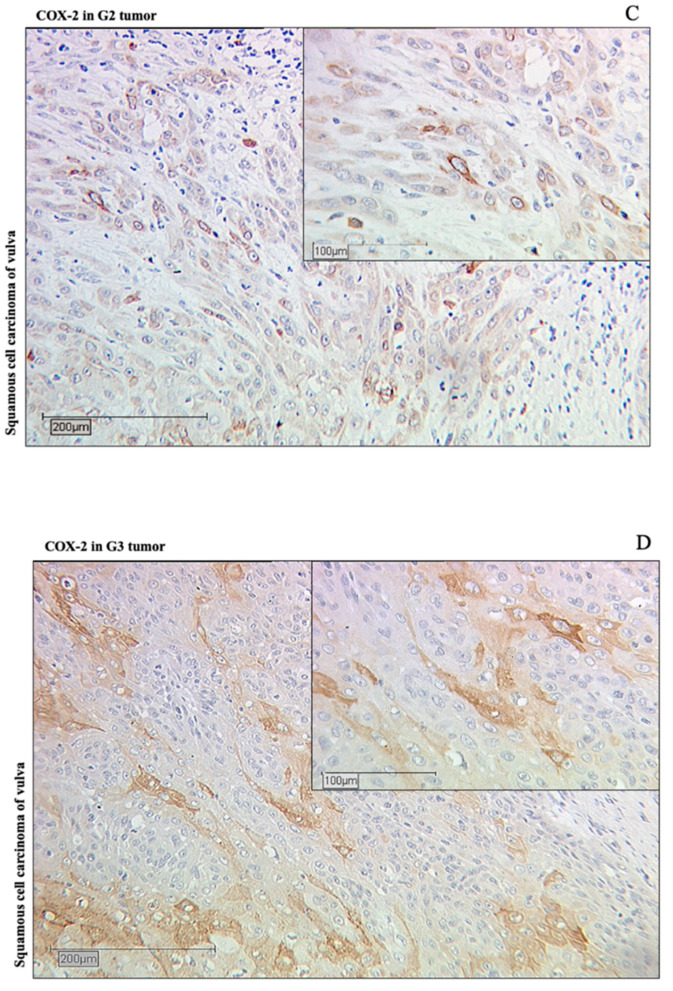
Boxplots (A) presenting positive correlation (* p = 0.001 in Spearman-Rho) between COX-2 positive tissue amount and the individual degree of tumor grading (G1: well-differentiated for (B), G2: moderately-differentiated for (C), G3: poorly-differentiated for (D)). The boxplots indicate mild outliers, which are marked with circles. These outliers show an interquartile distance to the third quartile of values that is less than three times higher than the third quartile of values. The numbers on the circles denote the cases (case numbers 5, 37, 57) in concern. Immunohistochemistry staining of cytoplasmic COX-2 (10× and 25× magnification) showing correlation to Grading 1–3 with increase of COX-2 intensity in vulvar cancer (B–D). The medians of the percentage COX-2 expression shown in the boxplots of the individual grading categories are represented in the immunohistochemical images of (B–D) (amount 10% in (B), amount 20% in (C), and amount 40% in (D)).


