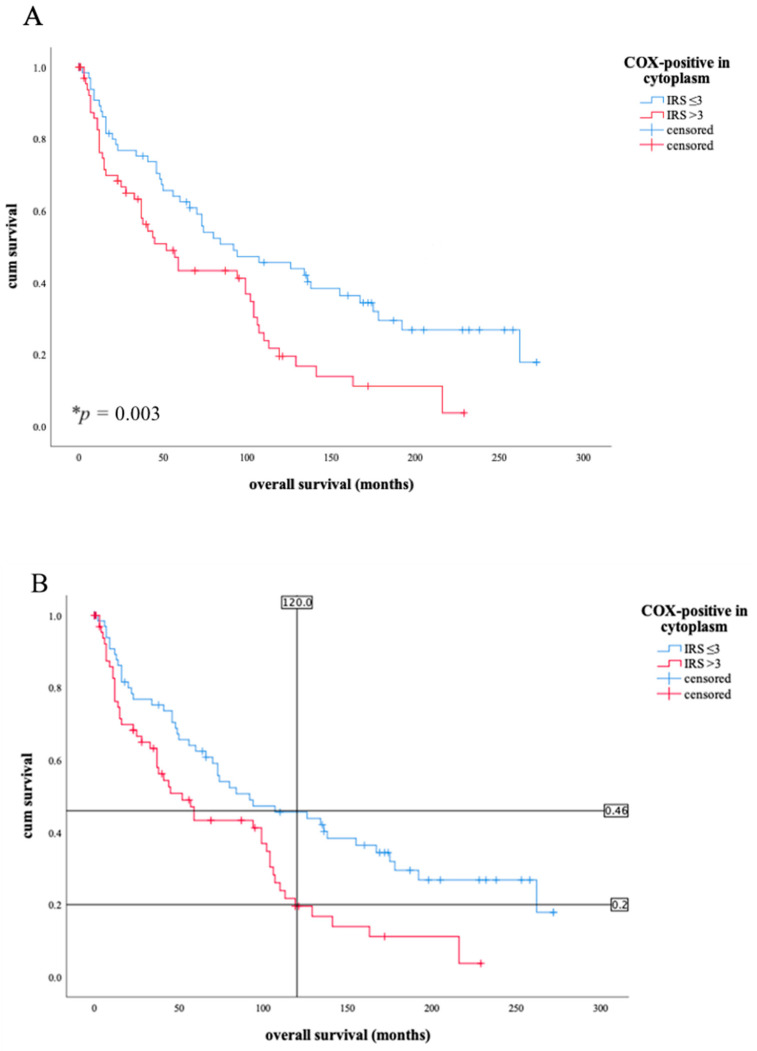
Figure 2.
As the Kaplan-Meier curve shows, patients with cytoplasmatic COX-2 expression according to immunoreactive score (IRS) > 3 survive for a shorter time period than patients with a lower IRS ((A), * p = 0.003). The blue line shows the survival curve of patients with COX-2 expression of IRS level ≤ 3, the red line shows the survival curve of patients with COX-2 expression IRS level above. The 10 year survival ((B), 120 months signed with vertical line) of a patient with IRS > 3 is about half as high as that of a patient with lower IRS. The horizontal lines in (B) illustrate the points of intersection on the Kaplan-Meier curves: IRS values above 3 show that 20% of patients live after 10 years; IRS values below 3 demonstrate that 46% of patients survive after the same time.

