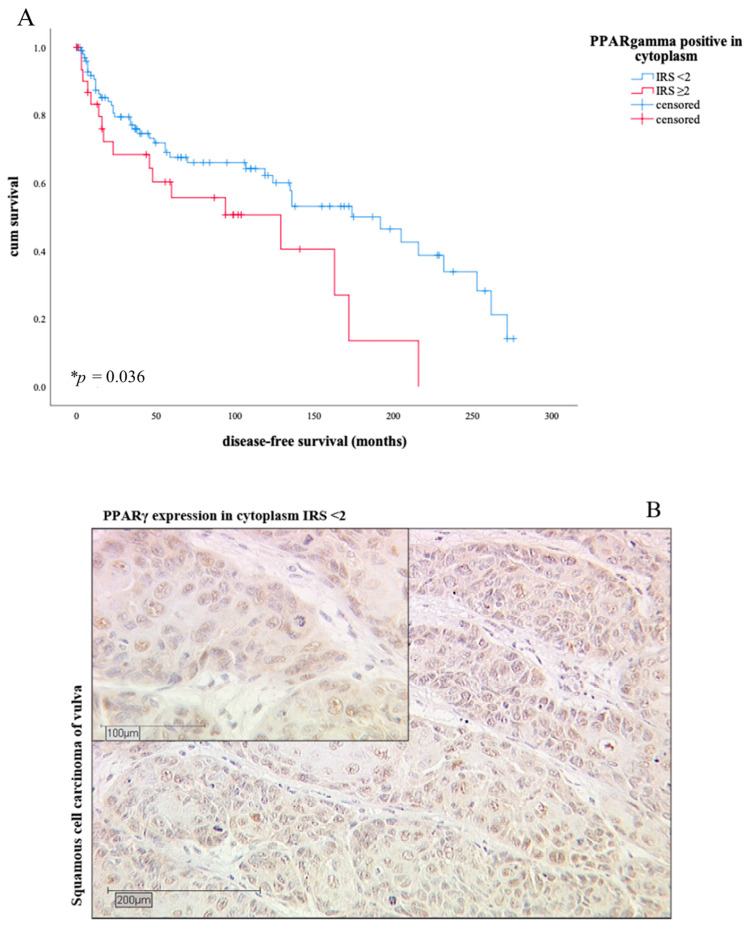
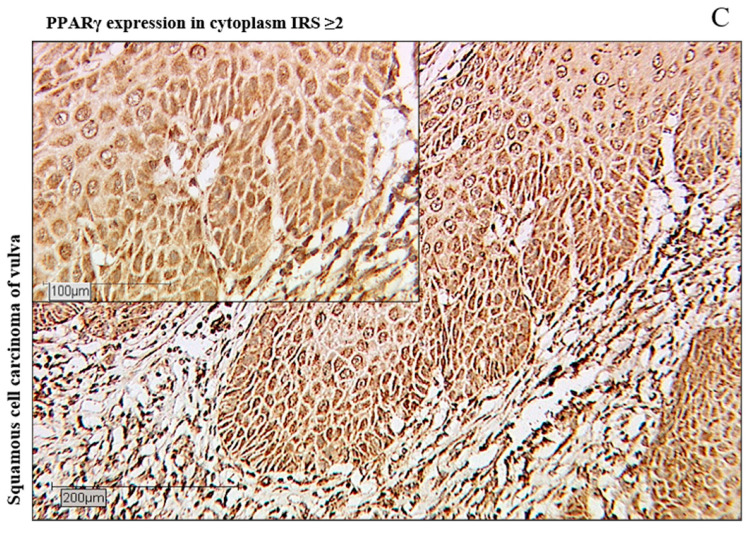
Figure 3.
As the Kaplan-Meier curve (A) shows, patients with cytoplasmic PPARγ expression according to IRS ≥ 2 survive a shorter time than patients with a lower IRS (* p = 0.036). The blue line shows the survival curve of patients with PPARγ expression of IRS level under 2, the red line shows the survival curve of patients with PPARγ expression IRS level ≥ 2. (B) shows an example of low expression level of PPARγ in cytoplasm (IRS < 2), (C) represent a high expression level of PPARγ (IRS ≥ 2) in cytoplasm, in contrast.


