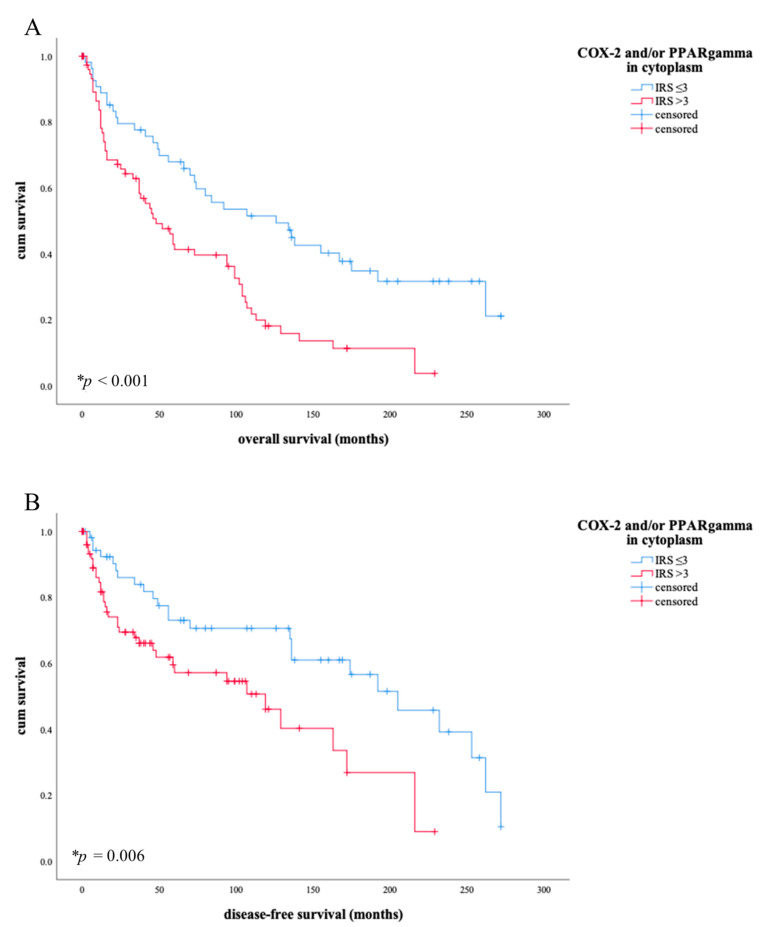
Figure 5.
When COX-2/PPARγ is expressed with IRS in cytoplasm >3, a shorter overall survival ((A), * p < 0.001) but also with regard to disease-free survival (B), * p = 0.006) can be derived. The blue line in (A) shows the overall survival of patients with COX-2/PPARγ expression in cytoplasm of IRS level ≤ 3, the red line shows the survival curve of patients with COX-2/PPARγ expression in cytoplasm of IRS level above 3. The blue line in (B) shows disease-free survival of patients with COX-2/PPARγexpression in cytoplasm of IRS level ≤ 3, the red line shows the survival curve of patients with PPARγexpression in cytoplasm of IRS level above 3. After 10 years, more than twice as many patients (0.5) live with lower IRS values than patients with expression of one or both factors (0.21) after IRS > 3. The situation is similar in disease-free survival: lower expression of COX-2 and/or PPARγ shows longer disease-free survival (0.7) than with higher expression of one or both factors (0.49).

