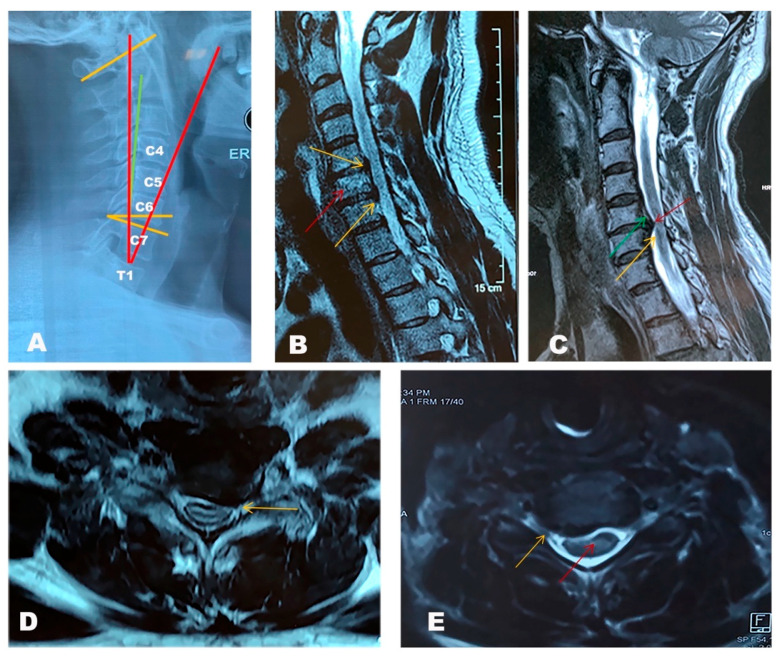
Figure 1.
Radiological features of degenerative cervical myelopathy (DCM). (A) Standing, lateral X-ray image of a DCM patient showing a normal sagittal balance. In this case, the degeneration did not arise from a severe mal-alignment but rather from degeneration of the structures in the spinal canal. Red: Cervical tilt; Green: cervical sagittal vertical alignment (SVA); Yellow: Cobb angle C1–7 and C7 slope angle. (B) T2 weighted sequence of a cervical spine MRI. Sagittal cuts showing C5–C6, C6–C7 and C7–T1 degenerative disc disease with posterior osteophytes compressing the spinal cord at C5–C6 (yellow arrow up) and C6–C7 (yellow arrow down). Type 1 Modic endplate changes at the inferior endplate of C5 and superior endplate of C6 indicate low grade inflammation at this level (red arrow). The relationship between inflammation at the endplates and discs and the presence of bacteria here is unclear. (C) Sagittal cuts showing multilevel disc disease with a protruding disc at C5–C6 indenting the spinal cord at this level. Hyper-intensity of the cord can be noticed or a white colour on the cord that under normal circumstances appears as black surrounded by a white signal (the cerebrospinal fluid), demonstrating evidence of myelomalacia (yellow arrow). T2 mapping also showing stenosis of the cervical vertebral canal cause by ossification of the posterior longitudinal ligament (OPLL) (green arrow) with a large osteophyte complex at this level (red arrow). The only symptoms showcased by this patient were mild axial neck pain and bilateral plantar paresthesias. (D) Axial cut through the C5–C6 disc showing a left sided disc bulge compressing the exiting nerve root at this level (yellow arrow). (E) Axial cut at the C4–C5 level showing a posterior osteophyte complex (yellow arrow) abutting the spinal cord and indenting it. A hyperintense signal can be seen in the cord at this level which could indicate myelomalacia (red arrow).

