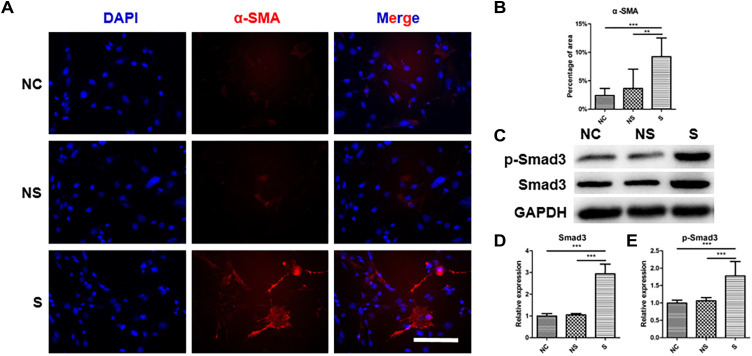
Figure 6.
The level of fibroblast activation under stimulations with serum from different origins. (A) The representative image of immunofluorescent staining of α-SMA in fibroblasts in different groups. (B) The quantification of the positive area of α-SMA relative to the total image in different groups. (C) The expression of Smad3 and p-Smad3 in fibroblasts with different stimulations, and related quantification (D and E). N=7. **p<0.01, ***p<0.001. Bar: 50μm.

