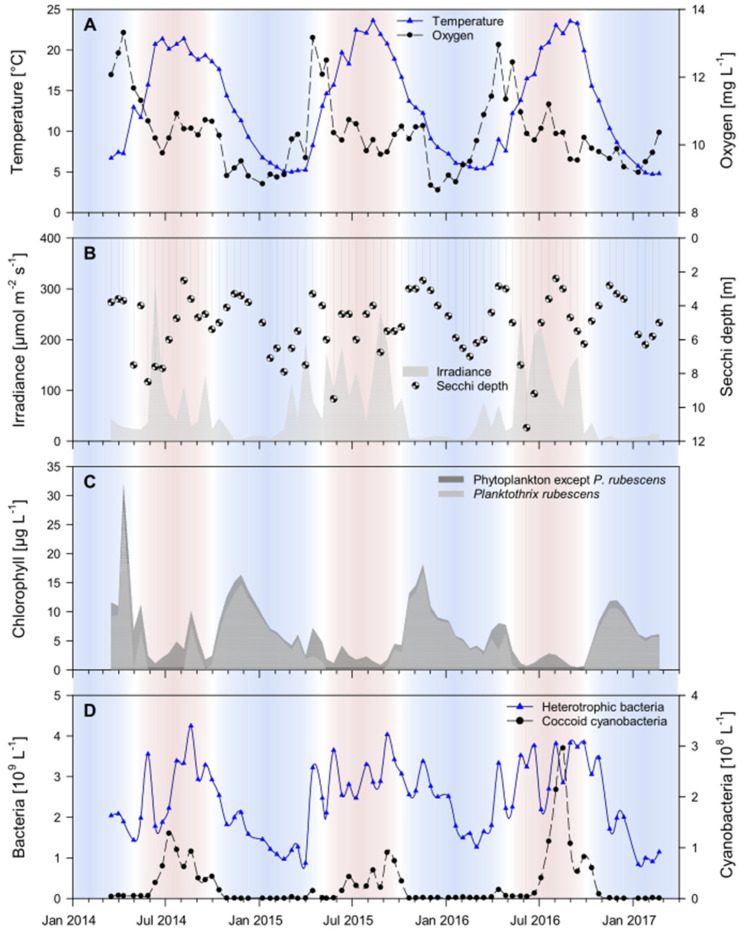
Figure 1.
Time-series data of environmental parameters. Seasonally fluctuating parameters were measured throughout the three-year sampling campaign in the epilimnion of Lake Zurich. In all panels, cold season months are colored in blue and warm-season months in red. Panel (A) shows water temperature (blue line) and oxygen concentration (black line). Panel (B) shows irradiance (grey area) and the Secchi depth (data points). Panel (C) shows chlorophyll concentration of all phytoplankton (dark grey area) and the fraction of Planktothrix rubescens-related chlorophyll concentration among the total chlorophyll concentration (light grey area). Panel (D) shows cell counts of all heterotrophic bacteria (blue line) as well as of coccoid cyanobacteria (black line).

