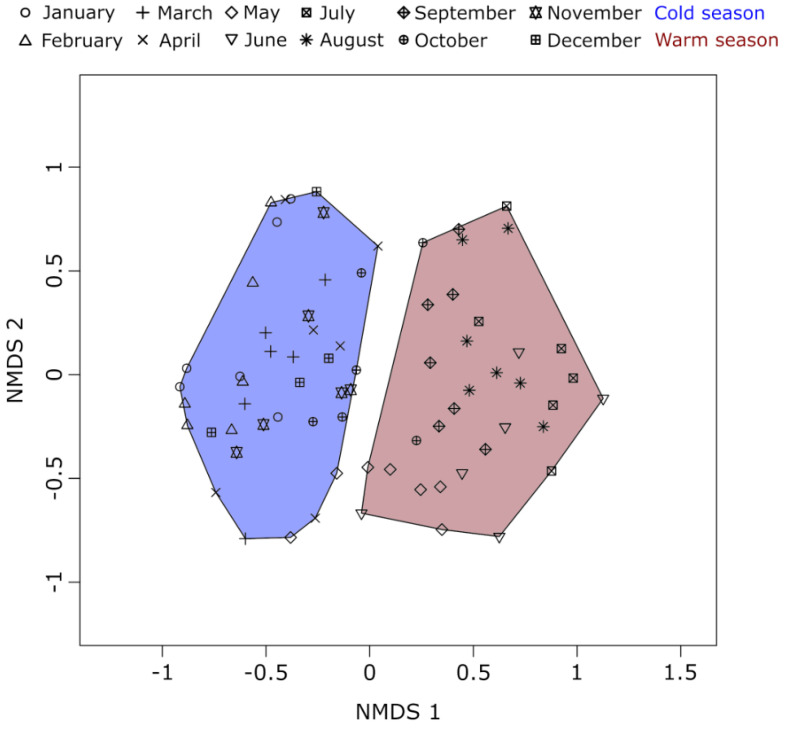
Figure 2.
Non-metric multidimensional scaling of time-series data. The scaling is based on Bray–Curtis dissimilarity values of metabarcoding community data between each pair of samples. Each symbol represents a different month of sampling and each sample was classified into either cold season (blue) or warm-season (red). With few exceptions, samples from October to April were classified as cold season and samples from May to September as the warm season. The stress for the scaling was 0.1826.

