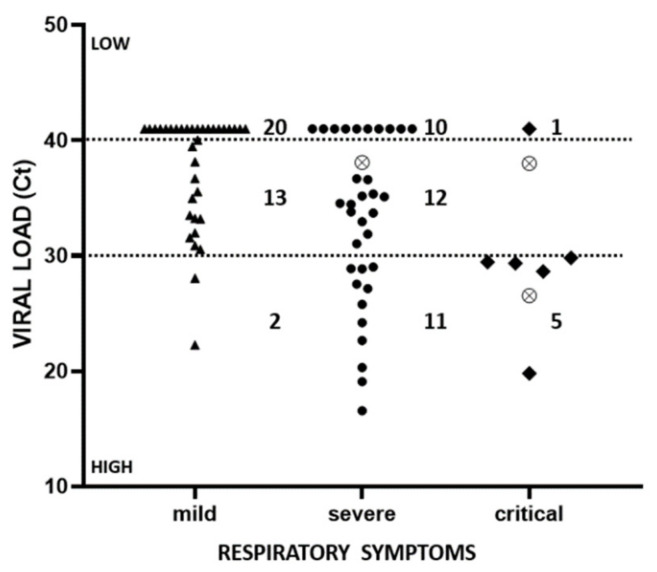
Figure 1.
Distribution of patients according to their NP (black symbol) and Ocular (crossed circles) viral load at the moment of hospitalization and the severity of their respiratory symptoms. Values on the ordinate axis report the number of PCR cycles at which the viral RNA became visible. Therefore, the higher this value, the lower the viral load.

