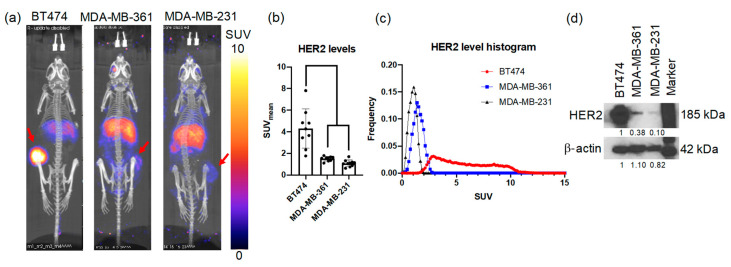
Figure 2.
[89Zr]-pertuzumab PET imaging indicates HER2 levels in three human breast cancer xenograft mouse models. (a) Representative [89Zr]-pertuzumab PET images in maximum intensity projection (MIP) view. Red arrows point to tumors. (b) Mean standard uptake values (SUVmean) of [89Zr]-pertuzumab PET. ANOVA and Tukey’s post hoc test: **** p < 0.0001. (c) Histogram plot of SUV of the three mouse models indicating the heterogeneity of HER2 expression as measured by PET imaging. (d) Western blotting of HER2 expression levels in BT474, MDA-MB-361, and MDA-MB-231 cells.

