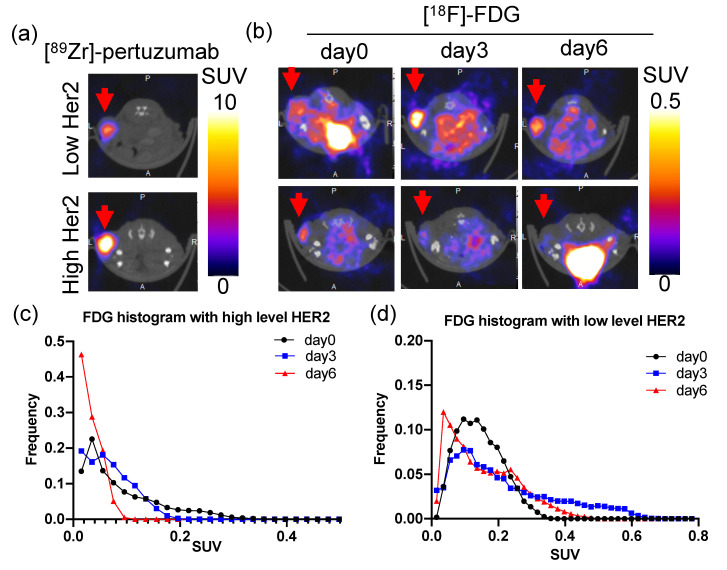
Figure 6.
HER2 expression level is correlated with paclitaxel treatment efficacy in BT474 tumor model. (a) Representative [89Zr]-pertuzumab PET images of BT474 tumors with high and low HER2 levels in transverse section. Red arrows point to tumors. (b) Representative [18F]-FDG PET images of BT474 tumors with high and low HER2 expression from day zero to day six in transverse orientation. Red arrows point at tumors. (c) Histogram plot of [18F]-FDG of BT474 tumor with high HER2 expression from day zero to day six. Kolmogorov–Smirnov test: day zero vs day three: p = 0.1641; day zero vs day six: p = 0.0072; day three vs day six: p = 0.9135. (d) Histogram plot of [18F]-FDG of BT474 tumor with low HER2 expression from day zero to day six. Kolmogorov–Smirnov test: day zero vs day three: p = 0.0015; day zero vs day six: p = 0.4005; day three vs day six: p = 0.0971.

