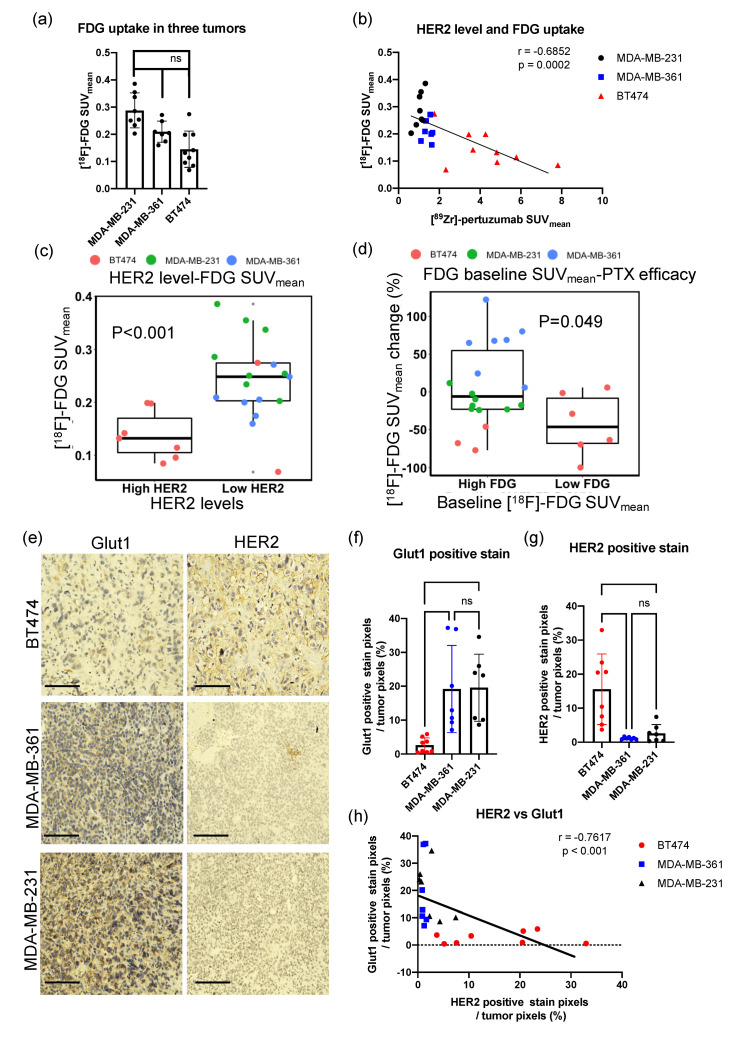
Figure 7.
High HER2 expression tumors have low glucose metabolism and are more sensitive to PTX treatment. (a) Baseline [18F]-FDG SUVmean of three tumor types. ANOVA and Tukey’s post hoc test: * p < 0.05; ** p < 0.01. (b) The baseline of SUVmean of [18F]-FDG is negatively correlated with SUVmean of [89Zr]-pertuzumab in three tumor models. Spearman’s correlation: r = −0.6852, p = 0.0002. (c) High HER2 (SUVmean 2.4) tumors had lower baseline SUVmean of [18F]-FDG than low HER2 (SUVmean < 2.4) tumors. Unpaired t-test: p < 0.001. (d) Low glucose metabolism (SUVmean < 0.15) tumors had more reduced SUVmean of [18F]-FDG from day zero to day six compared to high glucose metabolism (SUVmean 0.15) tumors. Unpaired t-test: p = 0.049. (e) Representative images of IHC of GLUT1 and HER2 from the center slice of the whole tumor consecutive sections. Scale bar: 125 μm. (f,g) Quantification of Ki67 (f) and GLUT1 (g) IHC staining of the whole tumor section shows MDA-MB-231 and MDA-MB-361 had significantly higher GLUT1 expression and lower HER2 expression than that of BT474 tumors (p < 0.05). One-way ANOVA and Tukey’s post hoc test: ns, non-significant; * p < 0.05; ** p < 0.01. (h) HER2 and GLUT1 IHC positive stain percentages were negatively correlated in the three tumor models. Spearman’s correlation: r = −0.7617, p < 0.0001.

