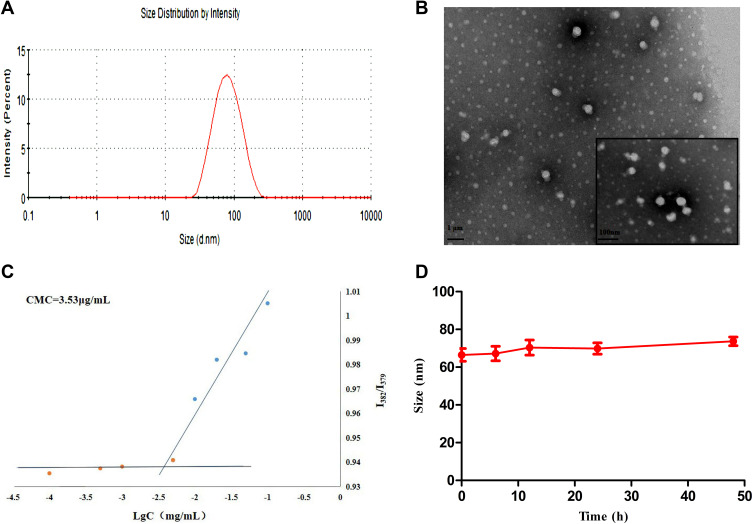
Figure 2.
(A) The particle size distribution of THDR-NPs measured by DLS. (B) TEM image of THDR-NPs using negative staining. (C) CMC of THDR-NPs measured by Fluorescence spectrophotometer. (D) Size changes of THDR-NPs over the course of 48 hours, indicating the stability of the NPs.
Abbreviations: DLS, dynamic light scattering; TEM, transmission electron microscopy; CMC, critical micelle concentration; THDR-NPs, HA-DAS and TPGS mixed micelle system loaded with ROZ.

